 Measure Killer
How do I find broken visuals in my Power BI reports?
Run Tenant Analysis or Limited Tenant Analysis on the semantic models, then sort the Broken visuals column on the Power BI reports tab. Right-click a report or page for View broken visuals to see each one and why it broke.
Last updated · November 6, 2026
Steps
- Open Tenant Analysis or Limited Tenant Analysis and let the inventory pass (Phase 1) finish (details).
- On the Selection tab, tick the semantic models whose reports you want to check. Ticking a model pulls in every report connected to it.
- Click Analyze. Phase 2 also runs the used/unused analysis that counts the broken visuals (details).
- Open the Power BI reports tab and sort Broken visuals descending.
- Right-click a report or a page and pick View broken visuals. Each visual is listed with the reason: a missing column or measure, broken DAX, or a broken visual-level filter (details).
- To find the visual on the canvas, use Locate visual on page (details).
What you see
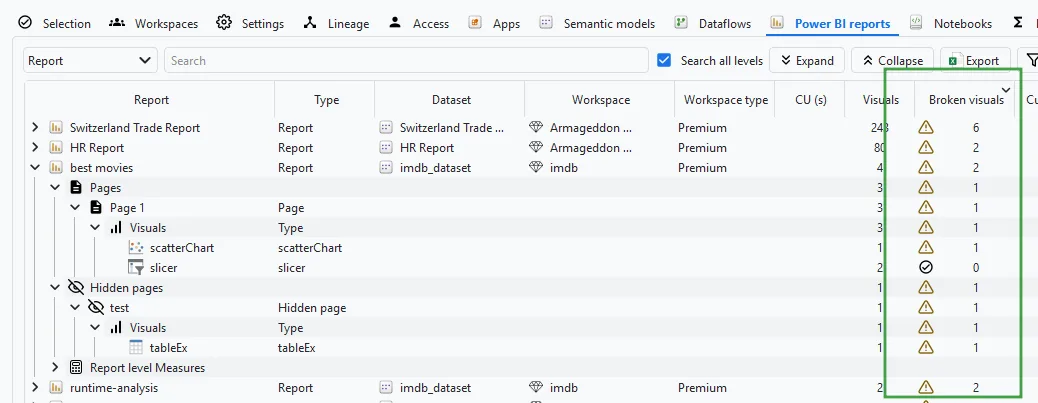
N/A in the column means no count is available yet, not zero: the report’s model has not been analyzed, or processing it hit an error.
Go deeper
- Find broken visuals in Power BI reports
- Find broken DAX: often the reason a visual broke
Something wrong or out of date on this page?