 Measure Killer
What your Excel users consume from your semantic model
Identified the Excel users of a Power BI semantic model? Drop their .xlsx files into Measure Killer to see exactly which columns and measures they reference.
Last updated · June 19, 2026
What you get
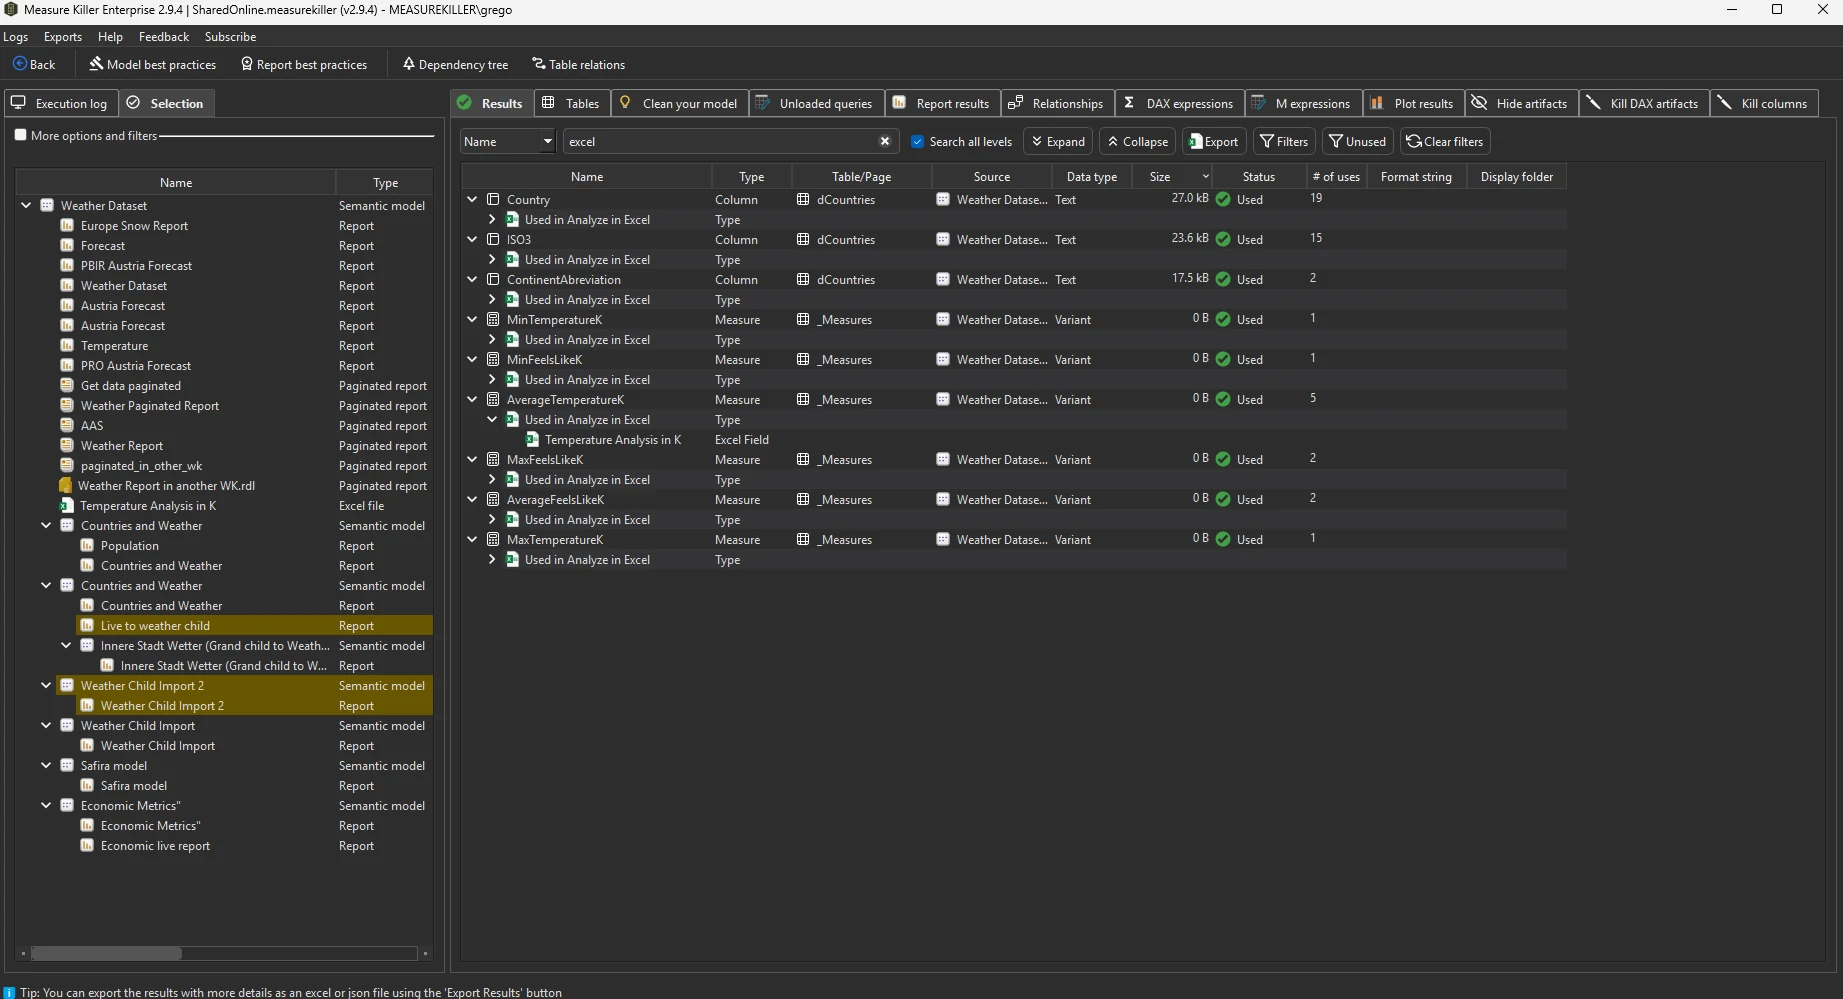
For every Excel file added to the analysis, Measure Killer tells you exactly which columns and measures from the semantic model that workbook is using. The goal is to see which fields the Excel files depend on so you don’t break anyone’s Excel analysis when cleaning up the model.
The Excel files appear in the dependency tree alongside Power BI reports and Paginated reports, so a column flagged as “unused” really means unused — not “unused in reports but pulled into someone’s pivot table”.
Note: Measure Killer shows which fields (columns and measures) Excel files reference — not consumption data like views or load times. There is no API to retrieve consumption metrics for Excel workbooks.
Prerequisite — identify the users first
This page assumes you already have the list of Excel users from the previous step. If you don’t, start there: Identify Excel users of a Power BI semantic model. The activity log gives you names; this step needs the actual files.
Collect the Excel files
The activity log tells you who is connecting, not what’s in their workbook. To analyze the contents, you need the file itself. Two practical routes:
- Ask the users directly — send the list from the previous step and ask them to share their working files (or the OneDrive / SharePoint links).
- Pull from the tenant — if the files live in a managed SharePoint / OneDrive location, your tenant admin can fetch them centrally.
Live “Analyze in Excel” workbooks without local data still work — Measure Killer reads the connection definition and the PivotTable fields. Refreshed workbooks where someone has imported the data into the worksheet won’t show up as connected and won’t help here.
Add the files to the analysis
- Open Measure Killer in a mode that analyzes the semantic model — typically Shared model online (for a model in the Power BI Service) or Single model and report (for a local file).
- Load the semantic model as you normally would.
- Drag and drop the .xlsx files into the Measure Killer window —
the same way you can drag and drop Power BI reports (
.pbix) or Paginated reports (.rdl) into any analysis. - Run the analysis.
Measure Killer reads the connection definition and PivotTable fields from each Excel file and assumes a live connection to the semantic model — it cannot validate whether the connection is still active. Each Excel file appears in the dependency tree as its own connected artifact, just like a Power BI report.
Read the results
In the results view you’ll see Excel files listed in the dependency tree next to the regular Power BI reports for the same semantic model. Expand any Excel file to see which columns and measures it references — the same per-field detail you get for Power BI reports.
Any column or measure used by at least one Excel file gets the same “used” status as if it had been referenced from a Power BI visual — so cleanup decisions for the model factor in Excel consumption automatically. This is the key benefit: you won’t accidentally remove a column that someone’s pivot table depends on.
Common workflows
- Pre-cleanup confirmation — before deleting a column the reports don’t use, add the active Excel files and confirm none of them depends on it.
- Migration planning — when consolidating two models, see which Excel workbooks point at which model and which fields are at stake.
- Audit “shadow” usage — measure how much business analysis lives in Excel rather than in governed reports, then decide whether to migrate it.
Limitations
- Workbooks where users copy/pasted values out of a refreshed connection can’t be detected from the file alone — the live connection is what Measure Killer reads.
- Files protected by sensitivity labels that block local opening can’t be
parsed on the desktop tool — see Trust & security for the
same caveat that applies to
.pbixanalysis.
Related
- Run your first online scan — the full walkthrough for scanning a shared semantic model in the Service
- Identify Excel users of a Power BI semantic model
- Find and remove unused measures