Find every instance of a visual type across your tenant
Search all Power BI reports for a specific visual type — map, Q&A, table, or any other — to audit usage, plan deprecations, or enforce design standards.
Last updated · July 7, 2026
What you get
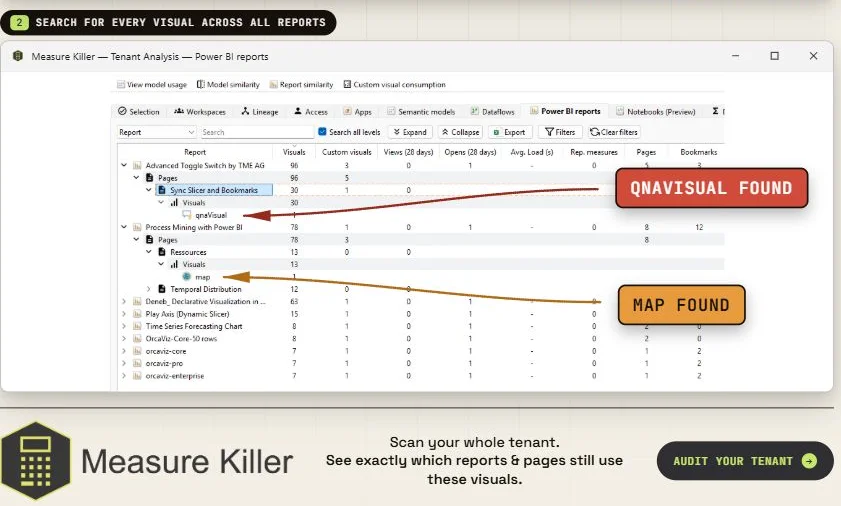
A flat list of every visual across all scanned Power BI reports, with:
- Name — the visual title (if set) or an auto-generated label
- Report — which report contains the visual
- Page — which page (tab) the visual sits on
- Type — the visual type (e.g.
barChart,map,filledMap,qnaVisual,tableEx,slicer) - Potential savings — how much model size is exclusively consumed by this visual
The Type column is what makes this powerful for auditing: sort or search by type and you immediately see every instance of a specific visual across your entire tenant — which reports, which pages, and what it depends on.
Why you need this
Deprecated visuals
Microsoft periodically deprecates standard visuals. When a visual is deprecated, it either stops working entirely or is automatically replaced — and the replacement may not behave identically. You need to know which reports are affected before the deadline.
Current deprecations:
- Q&A visual (
qnaVisual) — deprecated, will be removed in December 2026. Reports using this visual will break — the visual will stop rendering entirely. There is no automatic replacement. - Map (
map) and Filled Map (filledMap) — deprecated. These will be automatically replaced by Azure Maps (azureMap). The replacement is automatic but layout, formatting, or behavior differences may cause issues in specific reports.
Design standards
Enforce visual standards across your tenant — find every report using visual types your organization hasn’t approved or wants to phase out.
Impact analysis before changes
Before updating a shared visual template, custom theme, or organizational visual policy, see exactly how many reports and pages use each visual type — so you can estimate the blast radius.
Run the search
- Run a tenant-wide scan and complete Phase 2 for the reports you want to search.
- Open the Power BI reports tab.
- Use the search bar to find the visual type you’re looking for, or click the Filters button and use Exact match for a case-sensitive search that only returns the exact visual type.
Example — find all deprecated map visuals
- Open the Power BI reports tab.
- Click Filters, select Exact match, and search for
map(orfilledMap). The exact-match filter avoids false positives likeazureMap,treemap, oriconMapV3. - Every instance appears with its report and page — you now have the complete list of reports that need attention before Microsoft replaces these visuals with Azure Maps.
- For each affected report, open it in Power BI Desktop and verify the Azure Maps replacement renders correctly — check that formatting, conditional formatting, and drill-through behavior survived the migration.
Example — find all Q&A visuals before December 2026
- Open the Power BI reports tab.
- Search for
qnaVisualin the search bar (or use Filters → Exact match for a precise search). - Every Q&A visual appears with its report and page. Since Microsoft will remove this visual entirely (no automatic replacement), every hit on this list is a report that will break in December 2026.
- For each affected report, decide whether to replace the Q&A visual with a different visual type or remove it entirely. Prioritize by report views & opens — high-traffic reports should be fixed first.
Common workflows
- Pre-deprecation audit. Search for the deprecated visual type, export the list, and assign each affected report to an owner for remediation. Track progress by re-running the scan periodically — the count should go down to zero before the deadline.
- Visual standardization. Export the full visual list and group by Type. Identify visual types that are non-standard, underused, or redundant. Use this as input for an organizational visual policy.
- Post-migration validation. After a batch of reports has been updated (e.g. map → Azure Maps), re-run the scan and confirm the deprecated type no longer appears. Any remaining instances are reports that were missed.
- Pinpoint a visual on its page. Right-click any result and choose Locate visual on page to open a rendered preview of the page with that visual highlighted at its real coordinates — see Locate a visual on the page.
Related
- Dependency tree — related feature for exploring how visuals depend on model columns
- Best-practice analysis — report-level rules that flag other visual issues (too many visuals per page, implicit measures)
- Find broken visuals — visuals that render errors instead of data, with the reason per visual
- Report views & opens — prioritize remediation by traffic — fix high-usage reports first
- Custom visual consumption — audit custom (non-Microsoft) visuals for certification and licensing
- Run a tenant-wide scan — the scan that indexes every visual in every report