Best-practice analysis (reports + models)
Run the bundled rule pack over your reports and models — implicit measures, anti-patterns, missing relationships, naming — for a prioritized list of fixes.
Last updated · June 2, 2026
What you get
Measure Killer ships with two sets of best-practice rules — one for semantic models and one for Power BI reports. After a scan, each rule evaluates the model or report and surfaces violations with the affected object, a severity rating, and a direct link to the offending item.
Model rules cover issues like implicit measures, auto date/time tables, unused relationships, auto-detected relationships, oversized columns, missing sort-by columns, and DAX anti-patterns. Report rules cover implicit measures in visuals, hidden pages with no purpose, hidden visuals not referenced in bookmarks, and other layout issues.
Every model and report gets a best-practices score — a weighted count of violations, so the higher the number, the worse. Each one is rated on a scale from Power BI Pro (cleanest) through Good, Ok, Poor and Awful to Power BI Criminal (worst) — a quick way to compare governance quality across a tenant.
And yes, Measure Killer catches Power BI Criminals — we have it on tape:
Run the analysis
Local (free desktop edition)
- Open your
.pbixor.pbipfile in Power BI Desktop. - Launch Measure Killer — it attaches to the running instance automatically.
- Click Analyze to scan the model and its connected reports.
- Click Model best practices in the toolbar to see model-level violations, or Report best practices for report-level findings.
- Expand any rule to see every violation — the affected object, its location, and a severity indicator.
- Right-click a violation to jump directly to the object in the results view.
Online / tenant-wide (paid)
- Run a tenant-wide scan or an online single-model scan.
- After Phase 2 completes, select a semantic model and click View model usage.
- Open Model best practices or Report best practices from the toolbar — same rule pack, applied to the online metadata.
In Tenant Analysis, the Semantic models tab shows a Best practices score column for every scanned model, so you can sort the entire tenant by governance quality and focus on the worst offenders first.
Customize which rules to enforce
You can enable or disable individual rules in Settings (accessible from the launch window). This lets you tailor the analysis to your organization’s standards — enforce what matters, skip what doesn’t. Changes persist across sessions.
Model rules are configured on the Best practices tab. Each rule has a severity level (1–3) and a checkbox to include or exclude it. Use Select all / Unselect all to toggle in bulk, or search for specific rules.
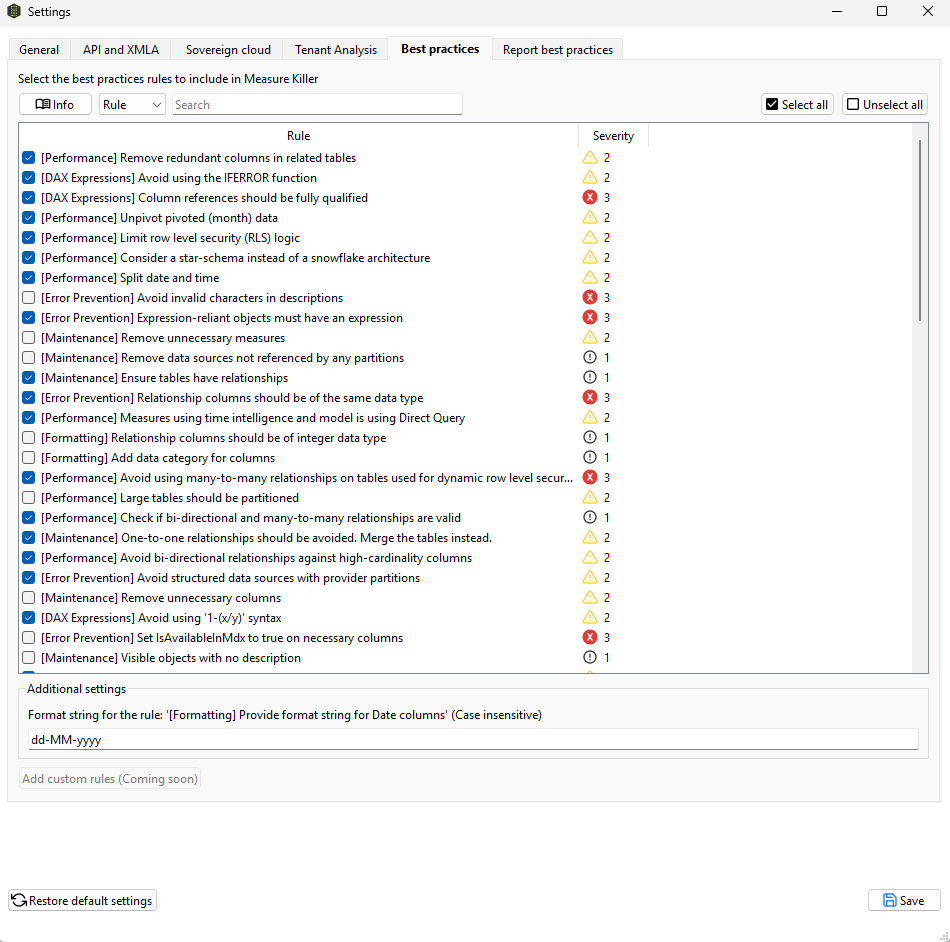
Model best-practice rule settings.
Report rules are configured on the Report best practices tab. Several rules have adjustable thresholds — for example, maximum visuals per page (default: 50), maximum objects per visual (default: 8), or maximum pages per report (default: 10). Adjust these to match your organization’s complexity tolerance.
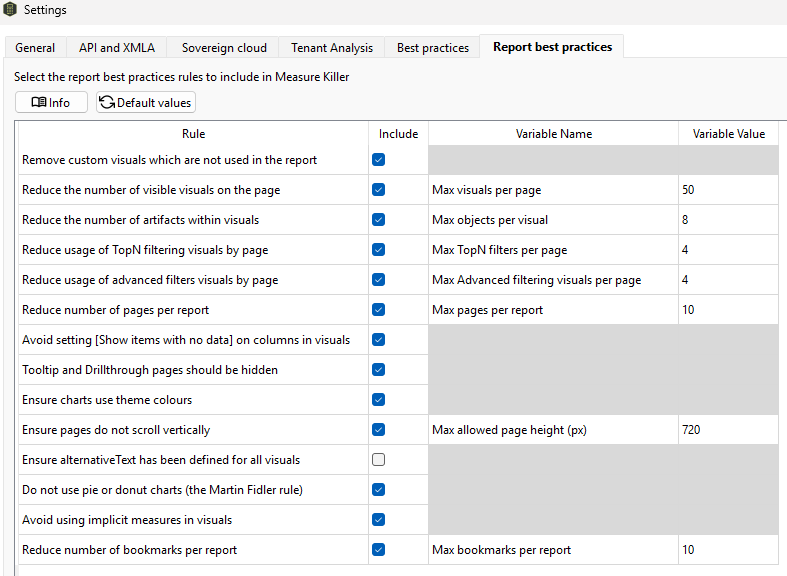
Report best-practice rule settings with adjustable thresholds.
Model best-practice rules
The model rule pack is organized by category. Each rule has a severity level (1 = info, 2 = warning, 3 = error) and can be individually enabled or disabled. Not all rules are on by default — check Settings to see which are active.
Performance
- Remove redundant columns in related tables — columns duplicated across related tables waste storage
- Do not use floating point data types — floating point columns are larger and slower than integer or fixed decimal
- Set IsAvailableInMdx to false on non-attribute columns — reduces storage overhead for columns not used in Analyze in Excel
- Avoid bi-directional relationships against high-cardinality columns — these force full table scans and degrade query performance
- Reduce usage of calculated columns that use the RELATED function — these are expensive to compute and can often be replaced with measures
- Consider a star-schema instead of a snowflake architecture — star schemas perform better in VertiPaq
- Unpivot pivoted (month) data — pivoted month columns should be unpivoted for proper time intelligence
- Split date and time — separate date and time into distinct columns for optimal compression
- Model should have a date table — required for proper time intelligence
- Date/calendar tables should be marked as a date table — enables DAX time-intelligence functions
- Remove auto-date table — auto date/time creates hidden date tables that bloat the model
- Limit row level security (RLS) logic — overly complex RLS expressions degrade query performance
- Avoid excessive bi-directional or many-to-many relationships — complex relationship topologies slow queries and produce unexpected filter propagation
- Minimize Power Query transformations — heavy M transformations slow refreshes and are better handled upstream
- Many-to-many relationships should be single-direction — bi-directional many-to-many relationships cause ambiguous filter paths
- Reduce usage of calculated tables — calculated tables are computed at refresh time and stored in memory
- Measures using time intelligence and model is using Direct Query — time intelligence functions behave differently in DQ mode
- Avoid using many-to-many relationships on tables used for dynamic row level security — this combination can produce incorrect security filtering (severity 3)
- Large tables should be partitioned — partitioning enables incremental refresh and reduces refresh time
- Check if bi-directional and many-to-many relationships are valid — validate that complex relationships are intentional
DAX Expressions
- No two measures should have the same definition — duplicates are a maintenance hazard
- No two calculated columns should have the same definition — same issue as duplicate measures
- Column references should be fully qualified — always use
Table[Column]not just[Column](severity 3) - Use the TREATAS function instead of INTERSECT for virtual relationships — TREATAS is more efficient
- Use the DIVIDE function for division — DIVIDE handles divide-by-zero gracefully
- Avoid using the IFERROR function — IFERROR evaluates both branches and hides real errors
- Measures should not be direct references of other measures — wrapper measures add overhead with no value
- Filter column values with proper syntax — use
CALCULATE(…, Table[Column] = "Value")notCALCULATE(…, FILTER(…)) - Filter measure values by columns, not tables — filtering by table is slower and less explicit
- Inactive relationships that are never activated — dead relationships that can be removed
- Avoid using ‘1-(x/y)’ syntax — use
DIVIDEinstead for safety and readability - The EVALUATEANDLOG function should not be used in production models — debugging function that impacts performance
Error Prevention
- Data columns must have a source column — orphaned columns without a source cause refresh failures
- Expression-reliant objects must have an expression — calculated objects without a DAX expression are broken (severity 3)
- Avoid the USERELATIONSHIP function and RLS against the same table — this combination can produce incorrect security filtering
- Relationship columns should be of the same data type — mismatched types cause implicit conversions and unexpected behavior (severity 3)
- Avoid invalid characters in names — special characters can break DAX references and tooling
- Avoid invalid characters in descriptions — same issue in metadata descriptions (severity 3)
- Set IsAvailableInMdx to true on necessary columns — required columns must be accessible in MDX for Analyze in Excel (severity 3)
- Avoid structured data sources with provider partitions — can cause refresh failures
Maintenance
- Remove unnecessary columns — columns with zero references
- Remove unnecessary measures — measures with zero references
- Remove data sources not referenced by any partitions — orphaned data sources that serve no purpose
- Ensure tables have relationships — orphaned tables are usually a mistake
- One-to-one relationships should be avoided. Merge the tables instead — one-to-one relationships add overhead without benefit
- Visible objects with no description — descriptions improve discoverability for report authors
- Calculation groups with no calculation items — empty calculation groups serve no purpose
Naming Conventions
- Object names must not contain special characters — keeps DAX references clean
- Trim object names — leading or trailing whitespace in names causes subtle bugs
- First letter of objects must be capitalized — consistent naming convention
Formatting
- Provide format string for measures — measures without format strings display raw numbers
- Provide format string for Date columns — configurable in
Additional settings (default:
dd-MM-yyyy) - Do not summarize numeric columns — prevents implicit measures from being created
- Add data category for columns — helps Power BI apply appropriate formatting and behavior
- Percentages should be formatted with thousands separators and 1 decimal — consistent percentage display
- Whole numbers should be formatted with thousands separators and no decimals — consistent number display
- Relationship columns should be of integer data type — integer keys are smaller and faster
- Hide foreign keys — foreign keys should not be visible to report authors
- Mark primary keys — marking primary keys improves model documentation
Report best-practice rules
The report rule pack checks for issues at the report, page, and visual level. Rules with adjustable thresholds show the default value in parentheses.
Report-level
- Reduce the total number of pages if it exceeds a threshold (default: 10 pages) — too many pages make reports hard to navigate
- Reduce number of bookmarks per report (default: 10 bookmarks)
Page-level
- Reduce the total number of visuals on each page if it exceeds a threshold (default: 50 visuals) — pages with too many visuals are slow to render
- Reduce usage of TOPN filters (default: 4 per page) — TOPN filters are expensive to evaluate
- Reduce usage of advanced filters (default: 4 per page)
- Hide tooltip/drillthrough pages — these pages should be hidden from end users
- Avoid vertical scrolling if the page is too tall (default: 720px max height)
Visual-level
- Remove unused custom visuals — custom visuals included in the report but not placed on any page
- Reduce the number of objects within visuals if it exceeds a threshold (default: 8 objects) — overstuffed visuals are hard to read and slow to render
- Avoid enabling “Show items with no data” — this setting forces Power BI to evaluate every combination, hurting performance
- Ensure visuals use theme colors rather than custom HEX values — keeps reports consistent and theme-friendly
- Provide alt text to improve accessibility — disabled by default; enable to enforce accessibility standards
- Use caution with pie/donut charts — these chart types are difficult to read accurately with more than a few slices
- Avoid using implicit measures — numeric columns dragged directly onto visuals instead of using explicit DAX measures (learn more)
What’s coming
Custom best-practice rules are on the roadmap — define your own rules with custom thresholds and severity levels, tailored to your organization’s governance standards. No ETA yet; check the feature comparison for the latest status.
Common workflows
- Pre-deploy review. Before publishing a model to the Service, run best-practice analysis locally and fix every high-severity finding. This catches implicit measures, auto date/time, and naming issues before they reach production.
- Triage a model handed over from another team. When you inherit a model you’ve never seen, best-practice analysis gives you an instant health check — the score and violation list tell you where to focus first.
- Tenant-wide governance audit. After a tenant scan, sort the Semantic models tab by Best practices score. The models with the highest scores are the ones that need attention (higher = more violations) — drill into each to see the specific violations.
What to do with the findings
- Fix in-place — for local files, address each violation directly in Power BI Desktop. Re-run Analyze in Measure Killer to confirm the fix and watch the score improve.
- Export — the full findings list can be exported as JSON for integration with governance dashboards or ticketing systems. For local scans in Power BI Desktop this works in every edition, including the free one. For online, workspace and tenant-level scans, exports require a paid license — they are deactivated for trial licenses.
- Share — save the
.measurekillerfile and hand it to a colleague who can open it and see the same findings without re-running the scan.
Related
- How to identify reports with implicit measures — deep-dive on the most common best-practice violation
- Find and remove unused measures and columns — the cleanup step that often follows a best-practice audit
- Run a tenant-wide scan — how to run best-practice analysis across every model in a tenant