Tenant summary
A single panel aggregating every Power BI and Fabric item type across your tenant or selected workspaces — the inventory most governance teams cannot produce.
Last updated · May 22, 2026
What you get
A compact panel that aggregates every Power BI and Fabric item type across your tenant into a single, scannable list. Full Tenant Analysis counts every workspace in the tenant; Limited Tenant Analysis counts only the workspaces you selected.
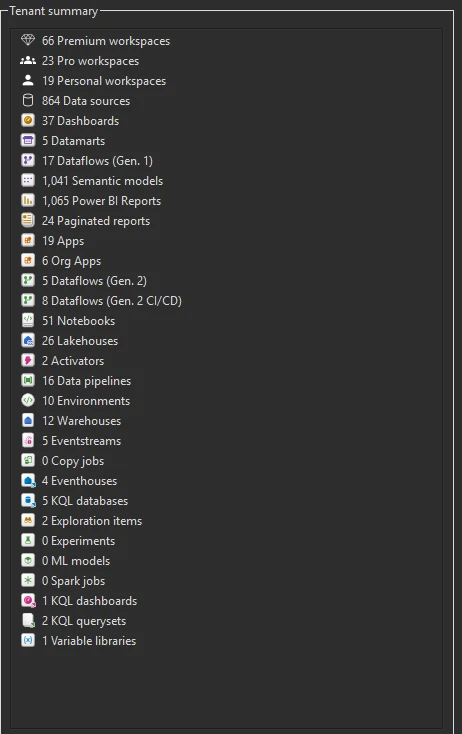
Three groups of counts are surfaced in the panel:
- Workspace types — Premium, Pro, and Personal workspaces.
- Power BI items — Data sources, Dashboards, Datamarts, Dataflows (Gen. 1, Gen. 2, Gen. 2 CI/CD), Semantic models, Power BI Reports, Paginated reports, Apps, Org Apps.
- Fabric items — Notebooks, Lakehouses, Activator, Data pipelines, Environments, Warehouses, Eventstreams, Copy jobs, Eventhouses, KQL databases, Exploration items, Experiments, ML models, Spark jobs, KQL dashboards, KQL querysets, Variable libraries.
Everything that lives in a Fabric tenant shows up here — there’s no “hidden” item type Measure Killer skips.
Full TA vs Limited TA — what changes
The same panel appears in both Tenant Analysis modes, but the numbers mean different things:
- Full Tenant Analysis (Fabric Admin) — counts every workspace in the tenant, including workspaces you aren’t a member of and personal workspaces (“My workspace”). This is the canonical tenant-wide inventory.
- Limited Tenant Analysis (Workspace Contributor / Viewer) — counts only the workspaces you selected in the workspace picker. Useful as a quick stocktake of your team’s slice of the tenant, but it won’t surface workspaces you can’t see.
Common workflows
- First inventory before a governance initiative. Run a Phase 1 scan — it finishes in minutes — and export or screenshot the Tenant summary as a baseline. You now know exactly how many workspaces, models, reports, dataflows, and Fabric items exist before defining policies or assigning ownership.
- Spot over-provisioned or orphaned areas. Compare item counts against what teams actually report owning. A workspace type with many models but zero report opens (check the Power BI reports tab) may contain orphaned content worth cleaning up.
- Track Fabric adoption over time. Run periodic scans and compare the Tenant summary exports. Rising Notebook, Lakehouse, or Warehouse counts show Fabric adoption; stagnant Dataflow Gen1 counts may mean migration hasn’t started yet.
What to do with the findings
- Export to Excel — click Export in the toolbar to export the tenant summary to Excel for reporting or sharing with stakeholders.
- Export as JSON — paid editions can also export as raw JSON, including per-item-type breakdowns, for governance dashboards or AI-assisted trend analysis.
- Share the
.measurekillerfile — hand the scan to a colleague who can open it and see the same summary without re-running the scan.
Related
- Run a tenant-wide scan — the scan that produces this summary
- Access & permissions tracking — full Tenant Analysis only
- Tenant Analysis UI reference — every tab and panel explained