 Measure Killer
Run your first online scan
Get a full impact analysis of a shared semantic model in the Power BI Service — every report, paginated report, Excel file, and model that depends on it.
Last updated · August 12, 2026
Power BI Service. This is not just the desktop scan in the cloud — an online scan against a shared semantic model is fundamentally bigger. The desktop scan answers “what’s in this one model that I can clean up?”; the online scan answers “what depends on this model anywhere in my tenant, and what will break if I change it?”. Requires a license key — paid Enterprise or an active free trial both work.
What an online scan actually covers
A shared semantic model in the Power BI Service can have many consumers, and a Measure Killer online scan walks all of them in one pass:
- Every Power BI report connected to the model — both reports authored on top of it and thin reports that live in other workspaces.
- Every paginated report (Power BI Report Builder) querying the model.
- Every Excel file connected via Analyze in Excel — by file and by user.
- Every downstream semantic model — composite and chained models that pull from this one, with the full chain tracked.
- Every report on those downstream models — so a column at the bottom of the chain is still traced back to anything that ultimately depends on it.
You can also drag and drop local files into the analysis to include
them in the dependency tree — Power BI reports (.pbix), Paginated
reports (.rdl), and Excel files (.xlsx). This is especially useful
for Excel files: Measure Killer reads their connection definitions and
PivotTable fields so you can see which columns and measures they
depend on, ensuring you don’t break anyone’s Excel analysis during
cleanup. See
Find what your Excel users are consuming
for the full walkthrough.
That full graph is what you need before changing anything in a shared model — rename a column, remove a measure, restructure a relationship — without quietly breaking something three hops away.
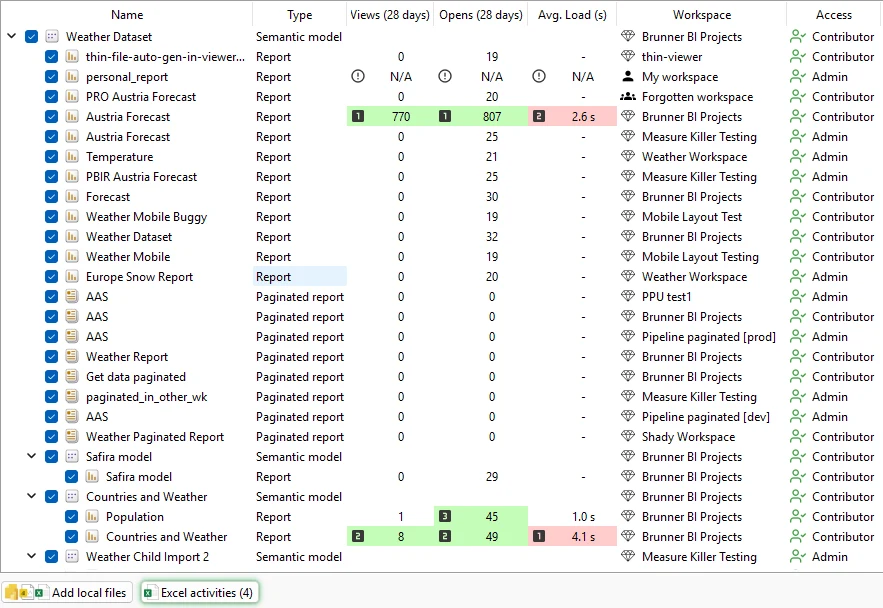
Here’s what that graph actually looks like in Measure Killer for a real shared model — one Weather Dataset semantic model at the top, with every connected Power BI report, every paginated report, every downstream semantic model (Safira, Countries and Weather, Weather Child Import) and the reports on those downstream models, each annotated with the workspace it lives in, the access level required, and recent open and page-view counts:
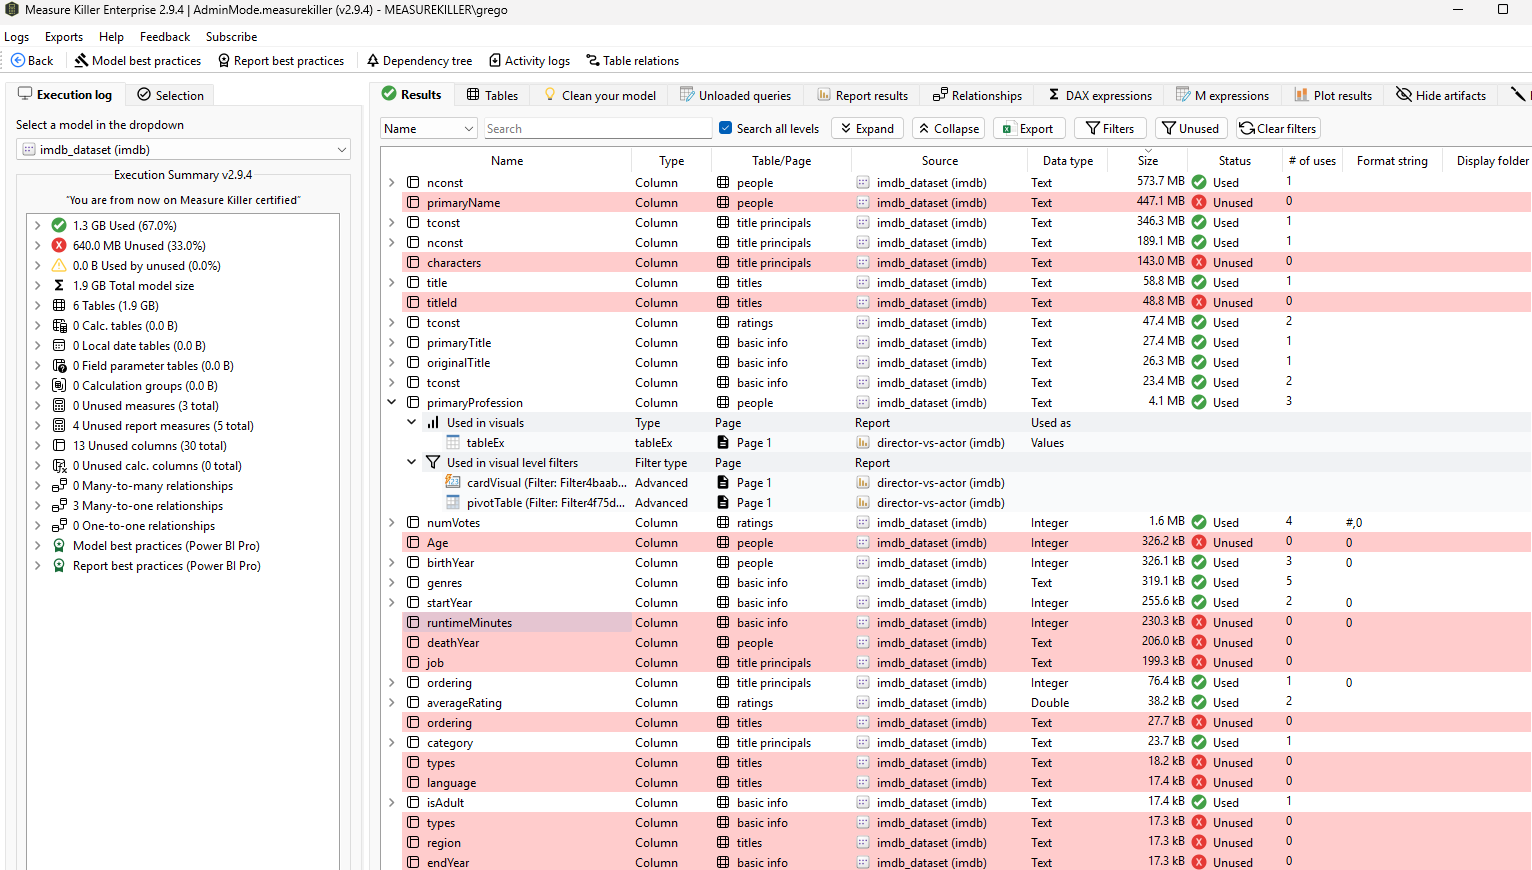
And once the scan finishes, the lineage turns into the Where-used table — every column and measure in the model with the consumers that reference it, what’s unused (highlighted in red), and what’s safe to remove. This is what the rest of this walkthrough builds toward:
Pick the mode — Developer or Admin
On the Measure Killer welcome screen, click Shared model online. There are two tiles with that name — one under Developers, one under Admins — and the right one depends on how much access you have to the tenant, not on what gets scanned (the scan itself is the same).
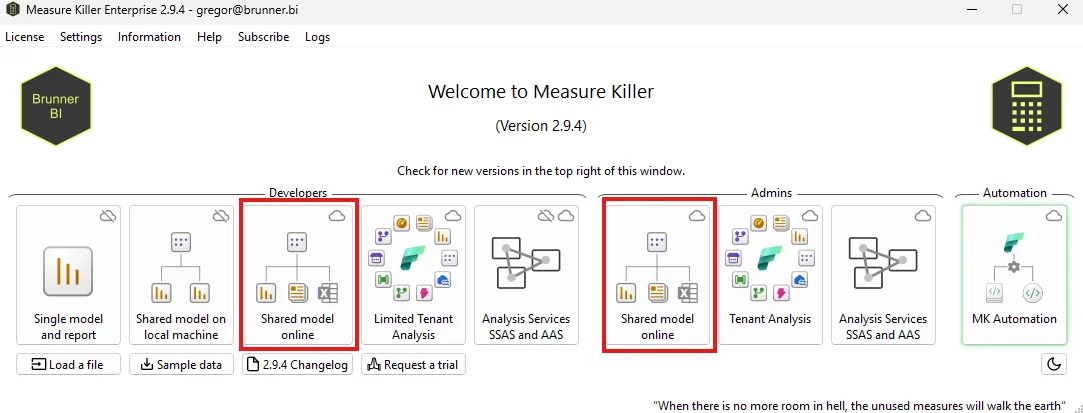
- Developers — Shared model online. Pick this if you only have workspace-level access. The minimum permissions for a successful scan are Viewer in every workspace that hosts a report, and Contributor in every workspace that hosts a semantic model. No tenant-admin role needed. The scan only sees what those workspace permissions allow.
- Admins — Shared model online. Pick this if you’re a Tenant admin / Fabric admin. Same scan, but Measure Killer uses the admin APIs to see every workspace and every consumer in the tenant — including workspaces you aren’t a member of, and personal workspaces (“My workspace”) which the Developer path can’t reach at all.
If you’re not sure, start with the Developer tile — it’ll surface permission errors clearly if any workspace falls outside what you can see, and you can switch later.
Connect to the Power BI Service
After picking a mode, Measure Killer opens your default browser with a Microsoft sign-in page. Log in with the Microsoft account that has the access level the mode requires — your normal workspace-level account for the Developer tile, or a tenant / Fabric admin account for the Admin tile.
The sign-in is a standard OAuth 2 flow. Measure Killer keeps the access token Microsoft returns and uses it to authenticate every Power BI / Fabric API call the scan needs. Your password never goes through Measure Killer — only the access token, scoped to the permissions your account already has.
Guest (B2B) user in someone else’s tenant? The sign-in resolves to your own home tenant by default. See Run Measure Killer as a guest user in another tenant for the two settings that point it at the host tenant instead.
Choose what to scan
Pick the path you’re on — they’re independent until the lineage step below, so you only need to read your own. Both paths converge again at See the lineage tree.
Developer path
Measure Killer opens a Dataset selection picker listing every workspace your account has access to. Drill into the workspace that owns the shared model, tick the semantic model itself, then click Next. The scan’s scope is that model plus every consumer Measure Killer can find within your workspace-level permissions — across the tenant, not just the workspace the model lives in.
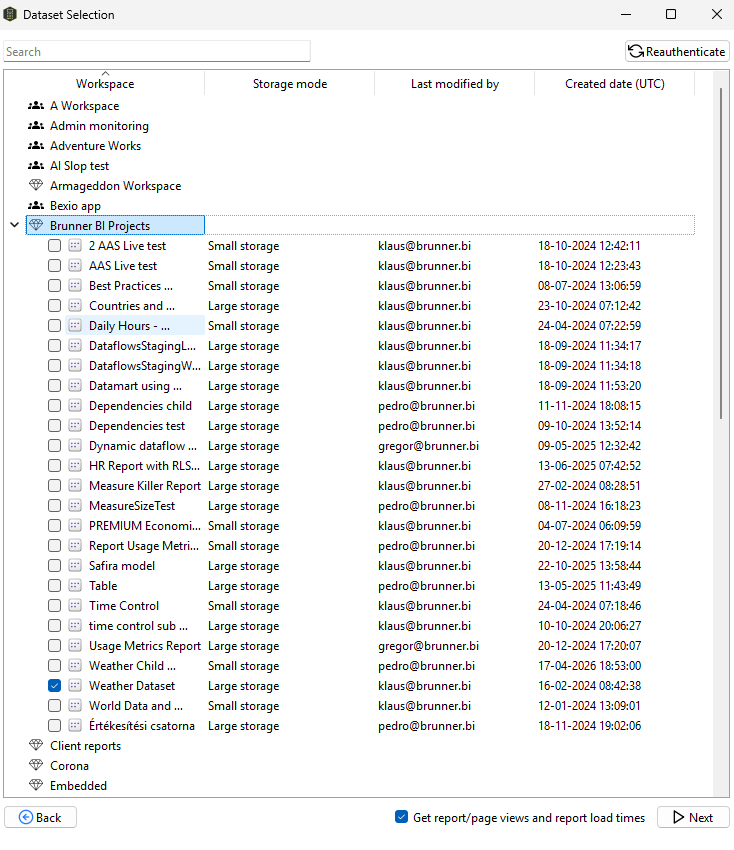
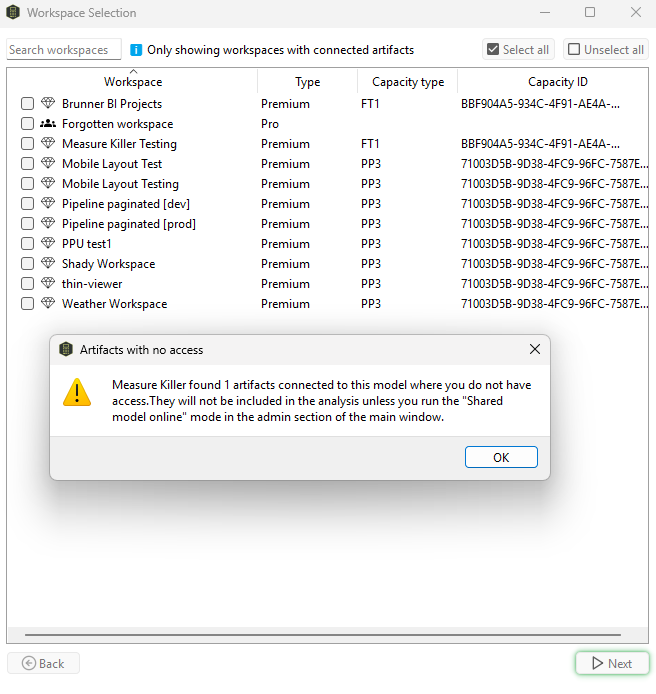
After picking the model, Measure Killer shows a follow-up Workspace Selection window — narrowed to only the workspaces that contain artifacts connected to the model you picked. By default all of them are on; you can uncheck any you don’t want crawled, then hit Next to start the scan.
Think carefully before unticking anything here: reports in an unselected workspace won’t be in the analysis. If you later change the model — rename a column, remove a measure — those excluded reports can quietly break, and Measure Killer won’t have flagged them. Only uncheck workspaces you’re certain you don’t need impact analysis for.
You may also see an Artifacts with no access popup over this window — Measure Killer detected artifacts connected to the model in workspaces your account can’t read. They’re skipped in Developer mode. This is exactly the gap the Admin path closes: re-run the same analysis from the Admins · Shared model online tile to pick them up.
Admin path
Measure Killer opens a Tenant Analysis filters window first — narrow the crawl before continuing, so the scan doesn’t have to walk the entire tenant looking for consumers.
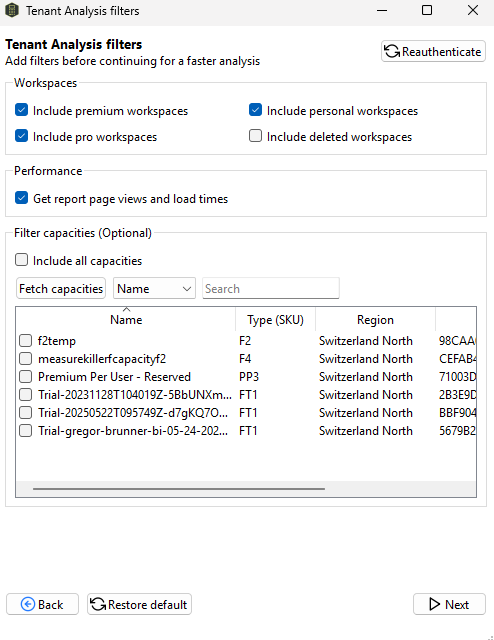
- Workspaces. Toggles for Premium workspaces, Pro workspaces, personal workspaces (“My workspace”), and deleted workspaces. Personal-workspace visibility is the headline Admin-only capability — flip it off here if you only care about shared content.
- Performance. Opt in to fetching report page views and load times alongside the scan. Gives you real usage data, costs extra time.
- Capacities (optional). Limit the scan to specific Fabric / Power BI capacities, or tick Include all capacities to leave it tenant-wide.
If you tick everything and run against a full tenant, the scan can take several minutes — Measure Killer has to crawl every workspace (and every personal workspace, if that toggle is on) looking for consumers. Narrow the filters first if you only care about a slice of the tenant.
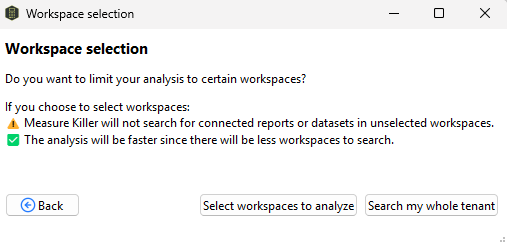
After clicking Next, Measure Killer asks whether to scope to specific workspaces or sweep the whole tenant (still constrained by the prefilters you just set). Picking workspaces is faster, but Measure Killer won’t follow consumers into any workspace you leave out — so if you genuinely don’t know where a shared model is consumed, the whole-tenant option is safer.
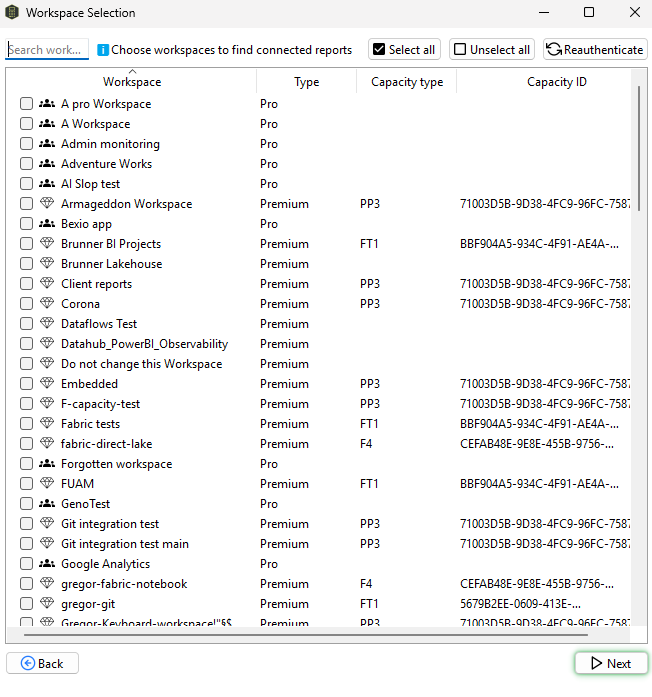
If you choose Select workspaces to analyze, Measure Killer pulls every workspace that matched the prefilters and shows them in a search-and-tick picker. The toolbar at the top has a search field plus Select all and Unselect all buttons that work against the current search, which is the fastest way to do inverse filtering:
- Click Select all — every workspace gets ticked.
- Type a keyword (e.g.
dev) in the search field — the list narrows to just the matching workspaces. - Click Unselect all — only the visible (filtered) workspaces get unticked.
- Clear the search — every workspace is selected except the ones
matching
dev.
Three clicks to drop every development workspace and keep everything else. Combine searches to subtract more groups.
With workspaces locked in, Measure Killer shows a Dataset selection picker — the same one developers see, now scoped to the semantic models that live in the workspaces you kept. Pick the model you want the impact analysis on, then click Next to start the scan.
See the lineage tree
Both paths converge here. With workspaces and dataset locked in, Measure Killer enumerates the connections and shows the lineage tree — the model at the top, every connected Power BI report and paginated report below it, every Excel consumer, every downstream semantic model, and the reports built on those downstream models. This is the impact-analysis surface you came for.
Each row also carries consumption metrics — opens and page views over the last 28 days, plus average report load time — so the reports nobody actually uses sit right next to the ones that get hit constantly.
Trim the scope
The lineage tree is also where you deselect items you don’t want included in the deep scan. Uncheck any report or downstream model you’re certain isn’t important. Two caveats:
- Anything unchecked is invisible to the analysis. If you later change the model, Measure Killer won’t have indexed those reports’ use of it — so columns or measures that look “unused” in the results might still be needed by something you excluded. Only drop items you don’t need impact analysis for.
- Consumption metrics make this safer. A report with 0 views and 0 opens in the last 28 days is a low-risk drop; one with 700+ views is not.
For tenants with a lot of dormant content, expand Advanced options at the top — there’s a checkbox to auto-uncheck every consumer with zero recent consumption, which saves a lot of manual ticking on a large lineage.
When the selection looks right, you’re ready to run the scan.
Run the scan
Click Analyze. Measure Killer reads the model directly via the
XMLA endpoint, and because XMLA needs its own authorization scope,
your default browser opens a second Microsoft sign-in popup. Approve
it (same OAuth 2 flow as the first sign-in) — Measure Killer then
indexes references against the live model plus every consumer still
ticked in the lineage. No .pbix files downloaded.
How long it takes
Scan time depends on metadata volume, not data volume. Measure Killer only reads structural metadata — table and column definitions, measure DAX, visuals, pages, relationships — so a 10 GB model with 10 measures actually scans faster than a 100 MB model with 1,000. What matters is the count of objects to walk:
- A typical semantic model: 2–3 seconds to scan.
- A typical report: ~1 second (small reports with a handful of visuals).
- One report with 1,000 visuals takes longer than 50 reports with one visual each — total visual / measure / column count is what drives the time, not how the items are distributed across reports.
End to end, expect anywhere from 10 seconds for a small model with a few connected reports, up to 15–30 minutes for hundreds of reports on large models. Genuinely huge tenants — many large models, hundreds of complex reports — can stretch past an hour.
Read the results
When the scan finishes, Measure Killer shows the full Where-used table: every column, measure, table and relationship in the model, with the table or page it belongs to, the data type, the in-memory size, and a count of how many consumers reference it. Rows highlighted in red are unused — nothing in the analyzed scope hits them, so they’re candidates for removal.
Expand any row to see the exact list of consumers that touch that column or measure:
- Connected reports — every Power BI report (in any workspace) that uses it.
- Paginated reports — paginated reports querying it.
- Excel consumers — Excel files connected via Analyze in Excel, with the users who built them.
- Downstream models & reports — composite / chained models built on top of this one, plus the reports on those downstream models — traced back to the columns and measures they ultimately depend on.
This is the impact list you scope changes against: rename a column → every consumer in the list needs updating; remove a measure → every consumer in the list may break.
Export the results
To take the findings out of Measure Killer, use the Exports button in the top-left — it writes the results out as Excel (a shareable documentation workbook of the model and its reports) or JSON (for AI, governance dashboards, or downstream tooling).
Now remove what’s unused
The online scan gives you a tenant-aware picture of what’s safe to remove. Acting on it is the next step: Find and remove unused measures and columns covers every removal method (Clean TMDL, 1-click cleanup, Kill DAX, Kill columns), which one to pick, and how to delete safely.
Next steps
- Run a tenant-wide scan — when you want every workspace at once, not just one model.
- End-to-end data lineage in Power BI