Report views & opens — page-level consumption data
Track which Power BI reports and individual pages are actually used — with open counts and page-view counts that accumulate beyond the 28-day limit.
Last updated · June 26, 2026
What you get
Two types of consumption data per report — and per individual report page:
- Report opens — how many times the report was opened in the period. One open = one user session, regardless of how many pages they viewed inside it.
- Page views — how many times each page (tab) inside the report was viewed. This is the page-level granularity: you can see that page 1 of a report has 400 page views while page 5 has zero.
For report render performance, see Report load times — a separate metric that tracks how long each report takes to fully open.
Power BI only exposes the last 28 days of consumption data. Measure Killer stores every fetch in a local SQLite database and merges fresh results on each scan, so your history accumulates beyond the 28-day ceiling automatically — no configuration required.
Opens and page views work for any user with Contributor access to the workspaces in scope — including Limited Tenant Analysis mode. No Fabric Admin role needed.
How the 28-day limit works — and how Measure Killer extends it
Power BI only retains the last 28 days of consumption data. Once a day falls outside that window, the data is gone from Microsoft’s side.
Measure Killer works around this:
- Each time you run a scan with page views enabled, Measure Killer pulls the available 28-day window.
- It writes the results into a SQLite database stored locally in
your
%APPDATA%folder. - On the next scan, fresh results are merged with what’s already stored — new days are appended, overlapping days are updated.
Run a scan weekly or monthly and the local database grows past the 28-day ceiling. After a few months you have a continuous consumption history that Microsoft no longer retains — months or years of report and page-level usage data, depending on how long you’ve been scanning.
This happens transparently. There is no setting to enable, no separate database to provision, and no licensing tier that gates the accumulation — it works the same way in every paid edition.
Where the data appears
Power BI reports tab
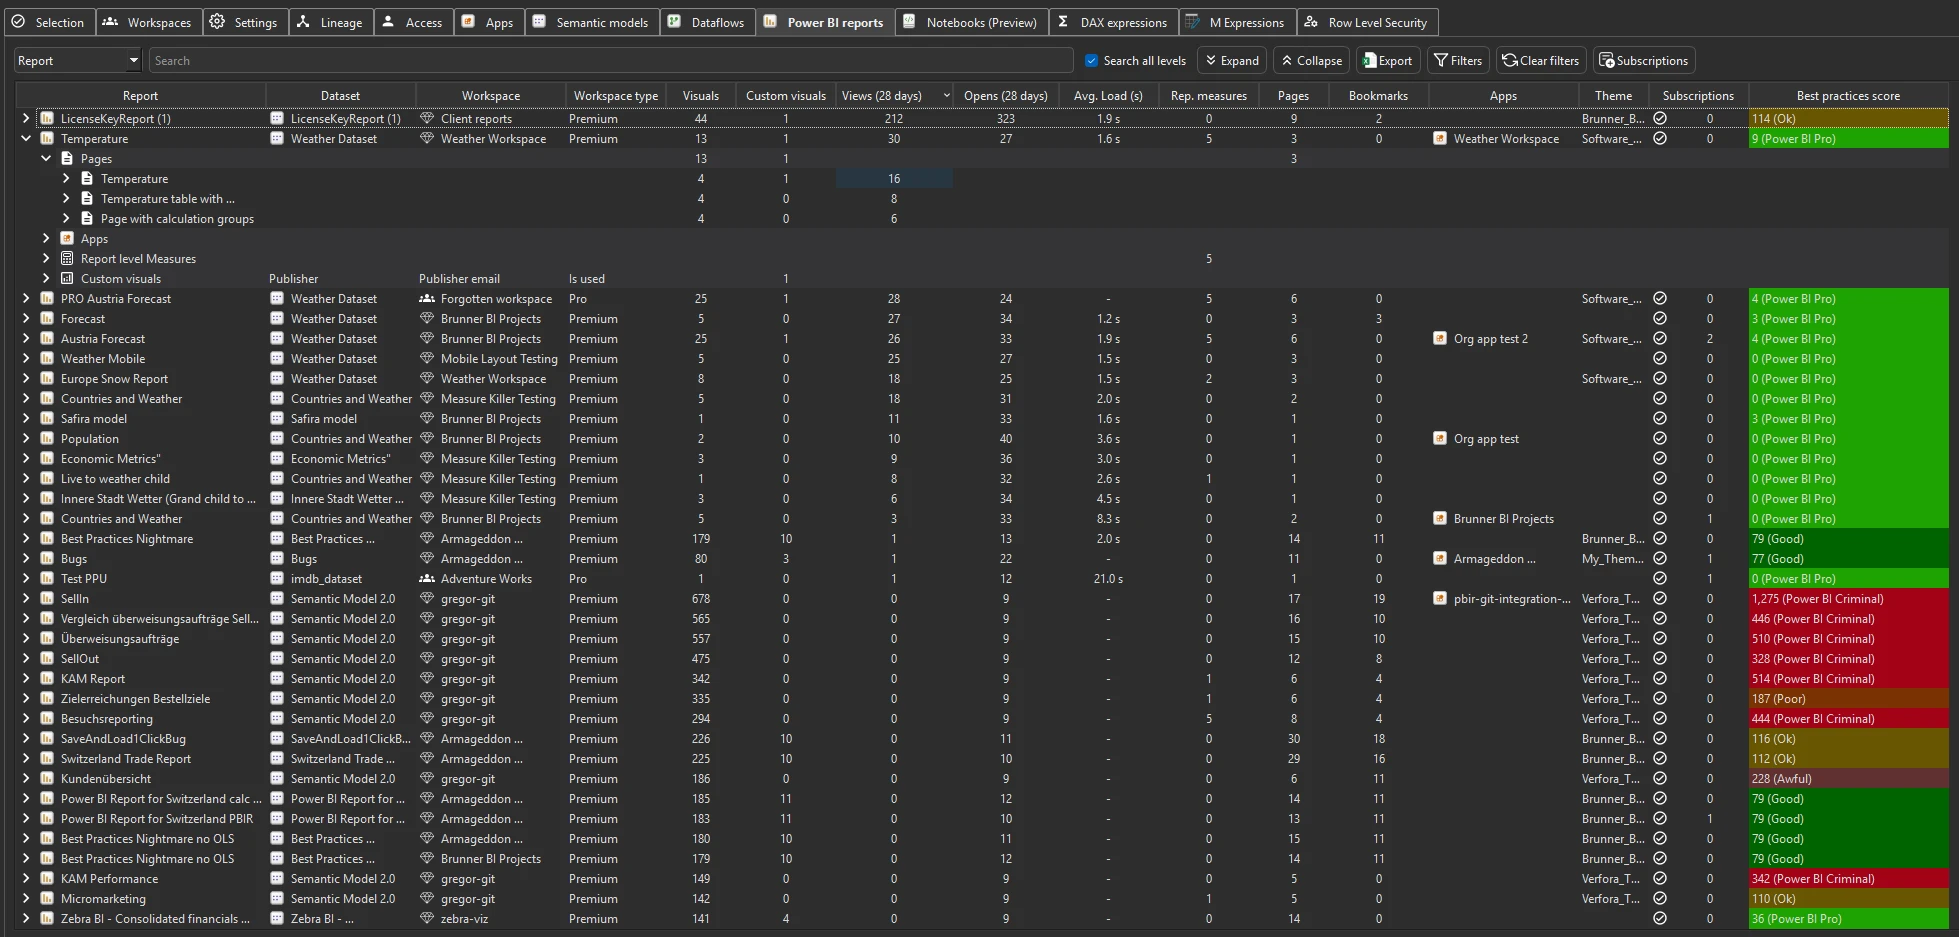
The Opens and Views columns on the Power BI reports tab show the default 28-day window per report — not the accumulated history. Opens is the report’s open events; Views is its aggregated page views over the same window. Expand a report row to see the per-page breakdown — each page listed with its own page-view count. For the long-term history, use the Report views window below.
Report views toolbar action
The Report views toolbar action in Tenant Analysis shows the raw consumption data — open counts per report and per page, broken out by date. You can browse the underlying numbers directly, see exactly which days had activity, and export to Excel for ad-hoc analysis. This is also the data that feeds into the Clean your model suggestions for reports and pages without recent consumption.
Clean your model suggestions
The consumption data feeds directly into Measure Killer’s cleanup recommendations. Reports and pages with zero consumption are flagged as candidates for archival or removal — so the “is anyone using this?” question is answered by data, not guesswork.
Run the analysis
- Run a tenant-wide scan — when configuring the pre-filters, make sure the page views toggle under Performance is enabled.
- Complete Phase 2 by selecting items and clicking Analyze.
- Switch to the Power BI reports tab and sort by Opens, Views, or Page views.
Selecting a model pulls its reports’ consumption too. In Phase 2, ticking a semantic model automatically pulls in every connected report along with its opens, page views, and average load times (and the model’s CU consumption) — you don’t have to tick each report individually. See Run a tenant-wide scan → Phase 2.
Build long-term consumption history
The key is regular scans. Each scan captures the current 28-day window and merges it into the local database. A practical cadence:
- Weekly — gives you a continuous, gap-free consumption history with full overlap between windows.
- Monthly — works well and captures the full window each time, though you may have small gaps if a scan is delayed.
After a few months of regular scanning, you’ll have a consumption history stretching back to whenever you started — well beyond what a single 28-day window can provide.
For unattended history collection, the same merge logic runs on a schedule in MK Automation. Results land in Fabric tables or your data warehouse rather than a local SQLite file — see MK Automation below.
Export the data
Desktop — Excel and JSON exports
The consumption data is visible as raw data in the app — you can browse the underlying numbers directly and export to Excel from the toolbar for quick sharing or ad-hoc analysis.
For programmatic use, the Exports sidebar includes two consumption-specific JSON datasets:
| Export | What’s in it |
|---|---|
| Report opens | Aggregated report opens by date |
| Report page views | Aggregated page views by date — page-level granularity |
JSON exports are written to a local folder. Use Full export to get everything in one bundle, or export each slice individually. Paid editions only — exports are disabled during the trial.
MK Automation — write to your data warehouse
MK Automation runs inside your Microsoft Fabric tenant on a schedule you control. Instead of local JSON files, results are written directly to Fabric Lakehouse or Warehouse tables — or any system reachable from a Fabric Notebook.
This is the path for teams that need to:
- Feed consumption data into Databricks, Snowflake, or another external warehouse for long-term governance reporting.
- Build Power BI reports on top of historical consumption data stored in Fabric tables.
- Route consumption findings into an automated governance workflow (Teams alerts, access-review systems, ticketing).
With Automation, the 28-day accumulation happens server-side on a schedule — no one needs to open the desktop app and run a manual scan.
Common workflows
- Find unused reports and pages. Sort the Power BI reports tab by Opens (ascending) to surface reports with zero opens. Expand each report to check individual pages — a report may have active pages and dead pages that can be removed independently.
- Justify report retirement. Export the consumption history to show stakeholders that a report has had zero opens for the last three months. The accumulated SQLite history gives you evidence beyond the 28-day window.
- Identify models serving unused reports. Capacity costs are charged against the semantic model, not the report. Combine consumption data with the semantic models inventory to find models whose reports have low or zero usage — retiring those reports reduces query load on the model and can help right-size your capacity.
- Governance baseline. Export consumption data quarterly and store it in your data warehouse. Track adoption trends, identify content sprawl, and measure the impact of cleanup initiatives over time.
Related
- Report load times — average render time per user for every report — the performance companion to this consumption data
- Power BI reports inventory — the tab where consumption columns appear alongside page counts, custom visuals, and subscriptions
- Find broken visuals — combine page views with the Broken visuals column to fix high-traffic breakage first
- Run a tenant-wide scan — the scan that collects consumption data (enable page views in the pre-filters)
- Identify Excel users — the same SQLite database accumulates activity-log history for Excel and XMLA connections
- Exports overview — full list of JSON exports including report opens, page views, and load times
- MK Automation — scheduled, unattended scans with results written to Fabric tables or your data warehouse