How Measure Killer defines used and unused
What counts as 'used' and 'unused' in a Measure Killer scan — the exact rules, the three statuses (green, yellow, red), and how scan scope affects confidence.
Last updated · June 22, 2026
Breaking, not consumption
Measure Killer’s definition is about breaking things, not about consumption or popularity. A column that one visual on one page references is “used” — even if nobody has opened that report in months. Whether anyone actually looks at a report is a separate question answered by consumption data.
The rule: if removing an object would break a report or change any visible output — even a subtle effect like a conditional-formatting rule that turns a cell background a different color — it counts as used. If nothing in the analyzed scope depends on it that way, it’s unused.
The 27 categories of usage
Measure Killer checks every way Power BI can wire a column or measure into a report, model, or security rule — across 27 distinct categories, at 99.99% reference-detection accuracy, the highest in the industry. That breadth is the whole point: miss a single category and you risk deleting an object that was quietly holding a report together. Every column and measure is tested against all 27 before it’s ever called “unused”.

The four statuses
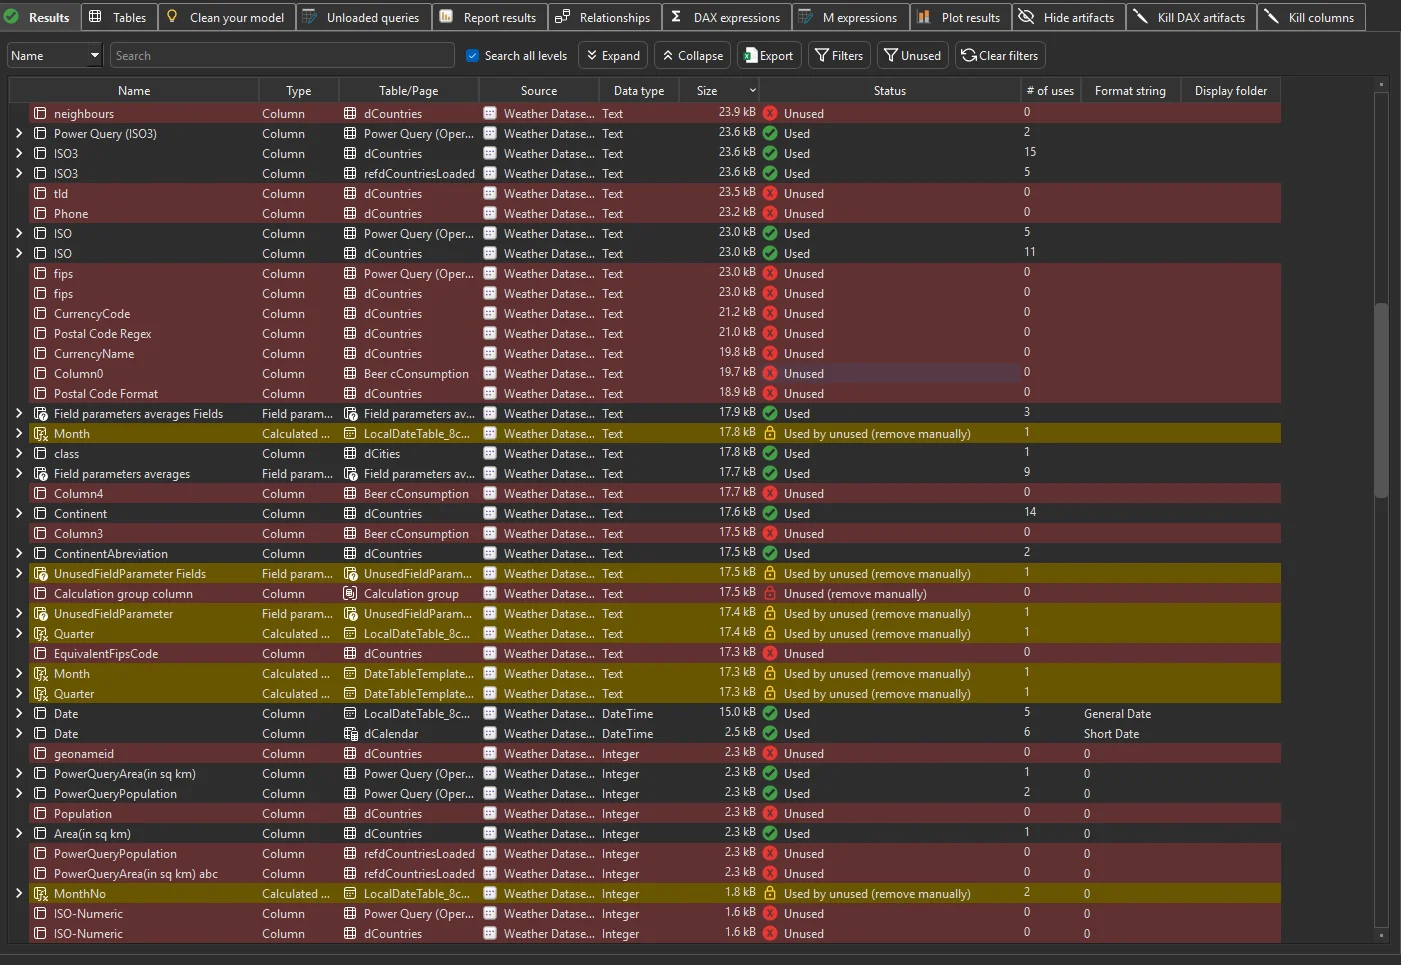
Measure Killer assigns one of four statuses to every column and measure:
- Green — used. At least one reference exists in the analyzed scope. Removing this object would break something.
- Red — unused. No reference exists in scope. This object can be safely removed (subject to the scope caveat below).
- Yellow — used by unused. The object is only referenced by other objects that are themselves unused. For example, a measure that is only consumed by another measure that nothing in any report hits. Once the red items are removed, the yellow items become genuinely unused too.
- Unused (remove manually). The object is unused, but Measure Killer cannot remove it automatically. The most common case is an unused column that belongs to a calculated table — removing a single column would require rewriting the DAX expression that defines the table, which Measure Killer will not do. Calculated tables are only removed automatically when all their columns are unused. Objects with this status need manual intervention in Power BI Desktop.
The batch removal methods — Clean TMDL and 1-click cleanup — remove red, yellow, and fully-unused calculated tables in one pass. “Remove manually” items are left in place for you to handle.
Scope affects confidence
The bigger the scope you analyzed, the more confident you can be that an “unused” row really is unused:
- Desktop scan (free) — only knows about the current
.pbixfile. A measure flagged as unused here might still be consumed by another report connected to the same shared model. - Online scan (Enterprise) — sees every report, paginated report, Excel file, and downstream semantic model connected to the shared model. Much higher confidence.
- Tenant-wide scan (Enterprise) — the broadest scope. Every report and downstream consumer across the entire tenant is in the analysis.
You can also drag and drop local files into any analysis to widen
the scope — Power BI reports (.pbix), Paginated reports (.rdl),
and Excel files (.xlsx). This is especially important for Excel:
Measure Killer reads their connection definitions and PivotTable
fields so columns and measures that Excel users depend on are
correctly marked as “used” rather than flagged for removal. See
Find what your Excel users are consuming.
Things to keep in mind
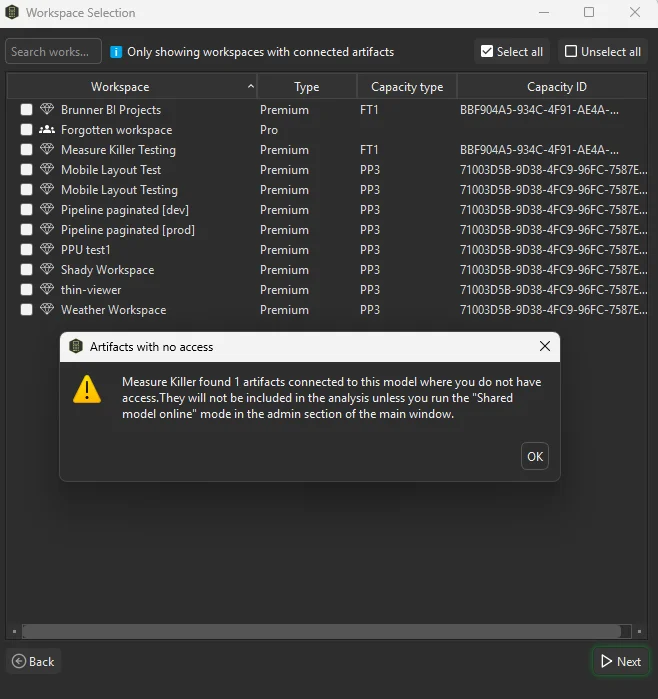
- Artifacts you can’t access. When running an online scan without admin permissions, Measure Killer may detect artifacts connected to the model in workspaces you don’t have access to. It warns you explicitly — these artifacts won’t be included in the analysis, so columns they reference could appear as “unused” when they aren’t. Run in admin mode (Shared model online → admin, or Tenant Analysis) to include everything — a Fabric Admin sees every artifact across the entire tenant, including personal workspaces.
- Cross-workspace consumers. If the online lineage shows reports in workspaces you don’t own, give those owners a heads-up before removing anything they might depend on.
- Excel users. Columns consumed only by Excel pivot tables won’t
show as used unless you include the Excel files in the scan
(online mode pulls activity-log data; for full column-level
detection, drag the actual
.xlsxfiles into the analysis).
What’s out of scope
Not every Power BI artifact type is supported. For the full list of what Measure Killer can and cannot analyze — file types, storage modes, visual support, and known limitations — see the compatibility page.
Related
- Find and remove unused measures and columns — the practical workflow for cleanup
- Compatibility & reference detection — supported file types, visuals, storage modes, and known limitations
- Dependency tree — the impact-analysis companion: what would removing this object save?