Tenant Analysis UI — tabs and toolbar reference
What every tab, sidebar item, and toolbar action does in Measure Killer's Tenant Analysis screen — a glossary for when other docs reference a specific name.
Last updated · June 12, 2026
Names match what you see in the app exactly — this doc is the single source of truth for those labels. Other how-to docs link here whenever they reference a specific tab or toolbar action.
Left sidebar — Execution log, Exports, Pre-filters
The left sidebar of the Tenant Analysis window has three tabs that control the scan and what comes out of it.
Execution log
A running history of what the current scan loaded or attempted, with
timestamps for each step. Shows which workspaces were scanned, which
items were fetched, and any errors or warnings encountered. The
“File loaded: …” line at startup confirms a saved .measurekiller
file was restored successfully. Useful for troubleshooting when a
scan takes longer than expected or when specific items fail to load.
Exports
The full list of raw JSON exports Measure Killer can write from a completed scan — DAX expressions, M queries, lineage, refresh events, RLS, report consumption (opens / page views / load times), best-practice violations, activity logs, and more. See Exports overview below for the full list.
Exports are written to a folder you choose via a save dialog. All exports are JSON files, grouped by type. You can export individual slices or use Full export to get everything in one bundle.
Pre-filters
The window that lets Admin-mode users narrow the crawl before the scan runs — Premium / Pro / personal / deleted workspace toggles, optional capacity filter, performance toggle for page views and load times. See Run a tenant-wide scan for the full walkthrough.
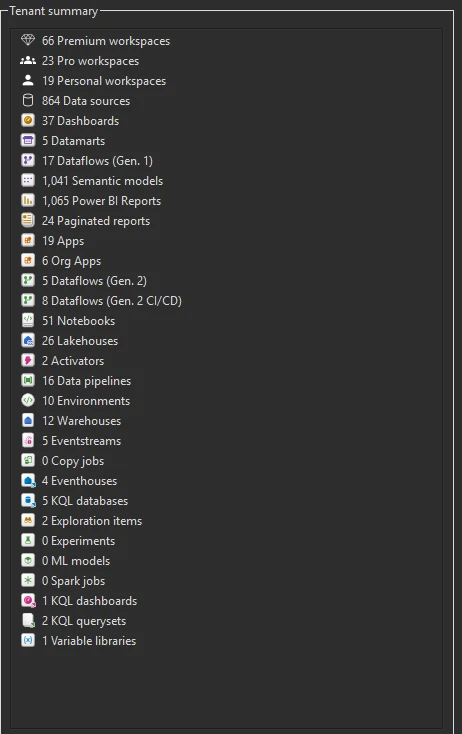
Tenant summary panel
A panel titled Tenant summary that aggregates every Power BI and Fabric item type across the tenant (in full Tenant Analysis) or across the workspaces you selected (in Limited Tenant Analysis). Lists workspace types, all Power BI item types, and every Fabric item type in one scannable column. See Tenant summary (workspaces, items, owners).
The Tenant summary panel is visible as a collapsible section on the left side, accessible from any right-side tab. It populates after Phase 1 completes.
Right-side tabs (analysis results)
These tabs sit along the top of the main pane after a scan finishes. Each one is a different slice of the scanned tenant.
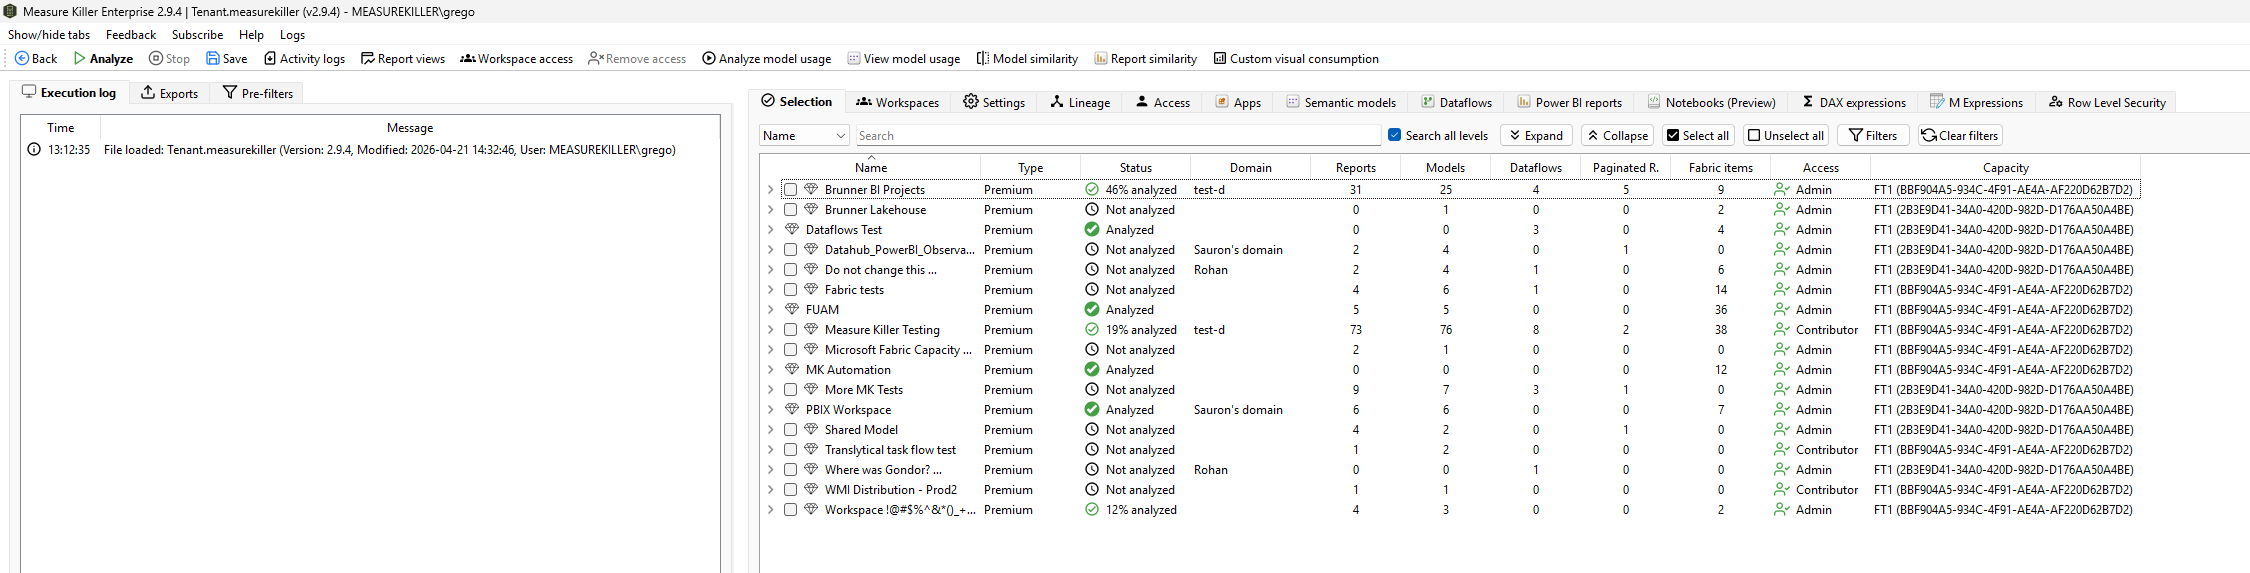
Selection
The main workspace overview table. Shows every workspace in scope with columns for:
- Name — workspace name, expandable to see individual items
- Type — Premium, Pro, or personal
- Status — Analyzed, Not analyzed, or a percentage (e.g. “46% analyzed”) showing Phase 2 progress
- Domain — the workspace’s Fabric domain, if assigned
- Item counts — Reports, Models, Dataflows, Paginated Reports, Fabric items
- Access — your access level (Admin, Contributor, Viewer)
- Capacity — the capacity ID the workspace is assigned to
This is where you tick workspaces and items for Phase 2. The toolbar buttons (Analyze model usage, Model similarity, etc.) activate based on what you’ve selected and analyzed here.
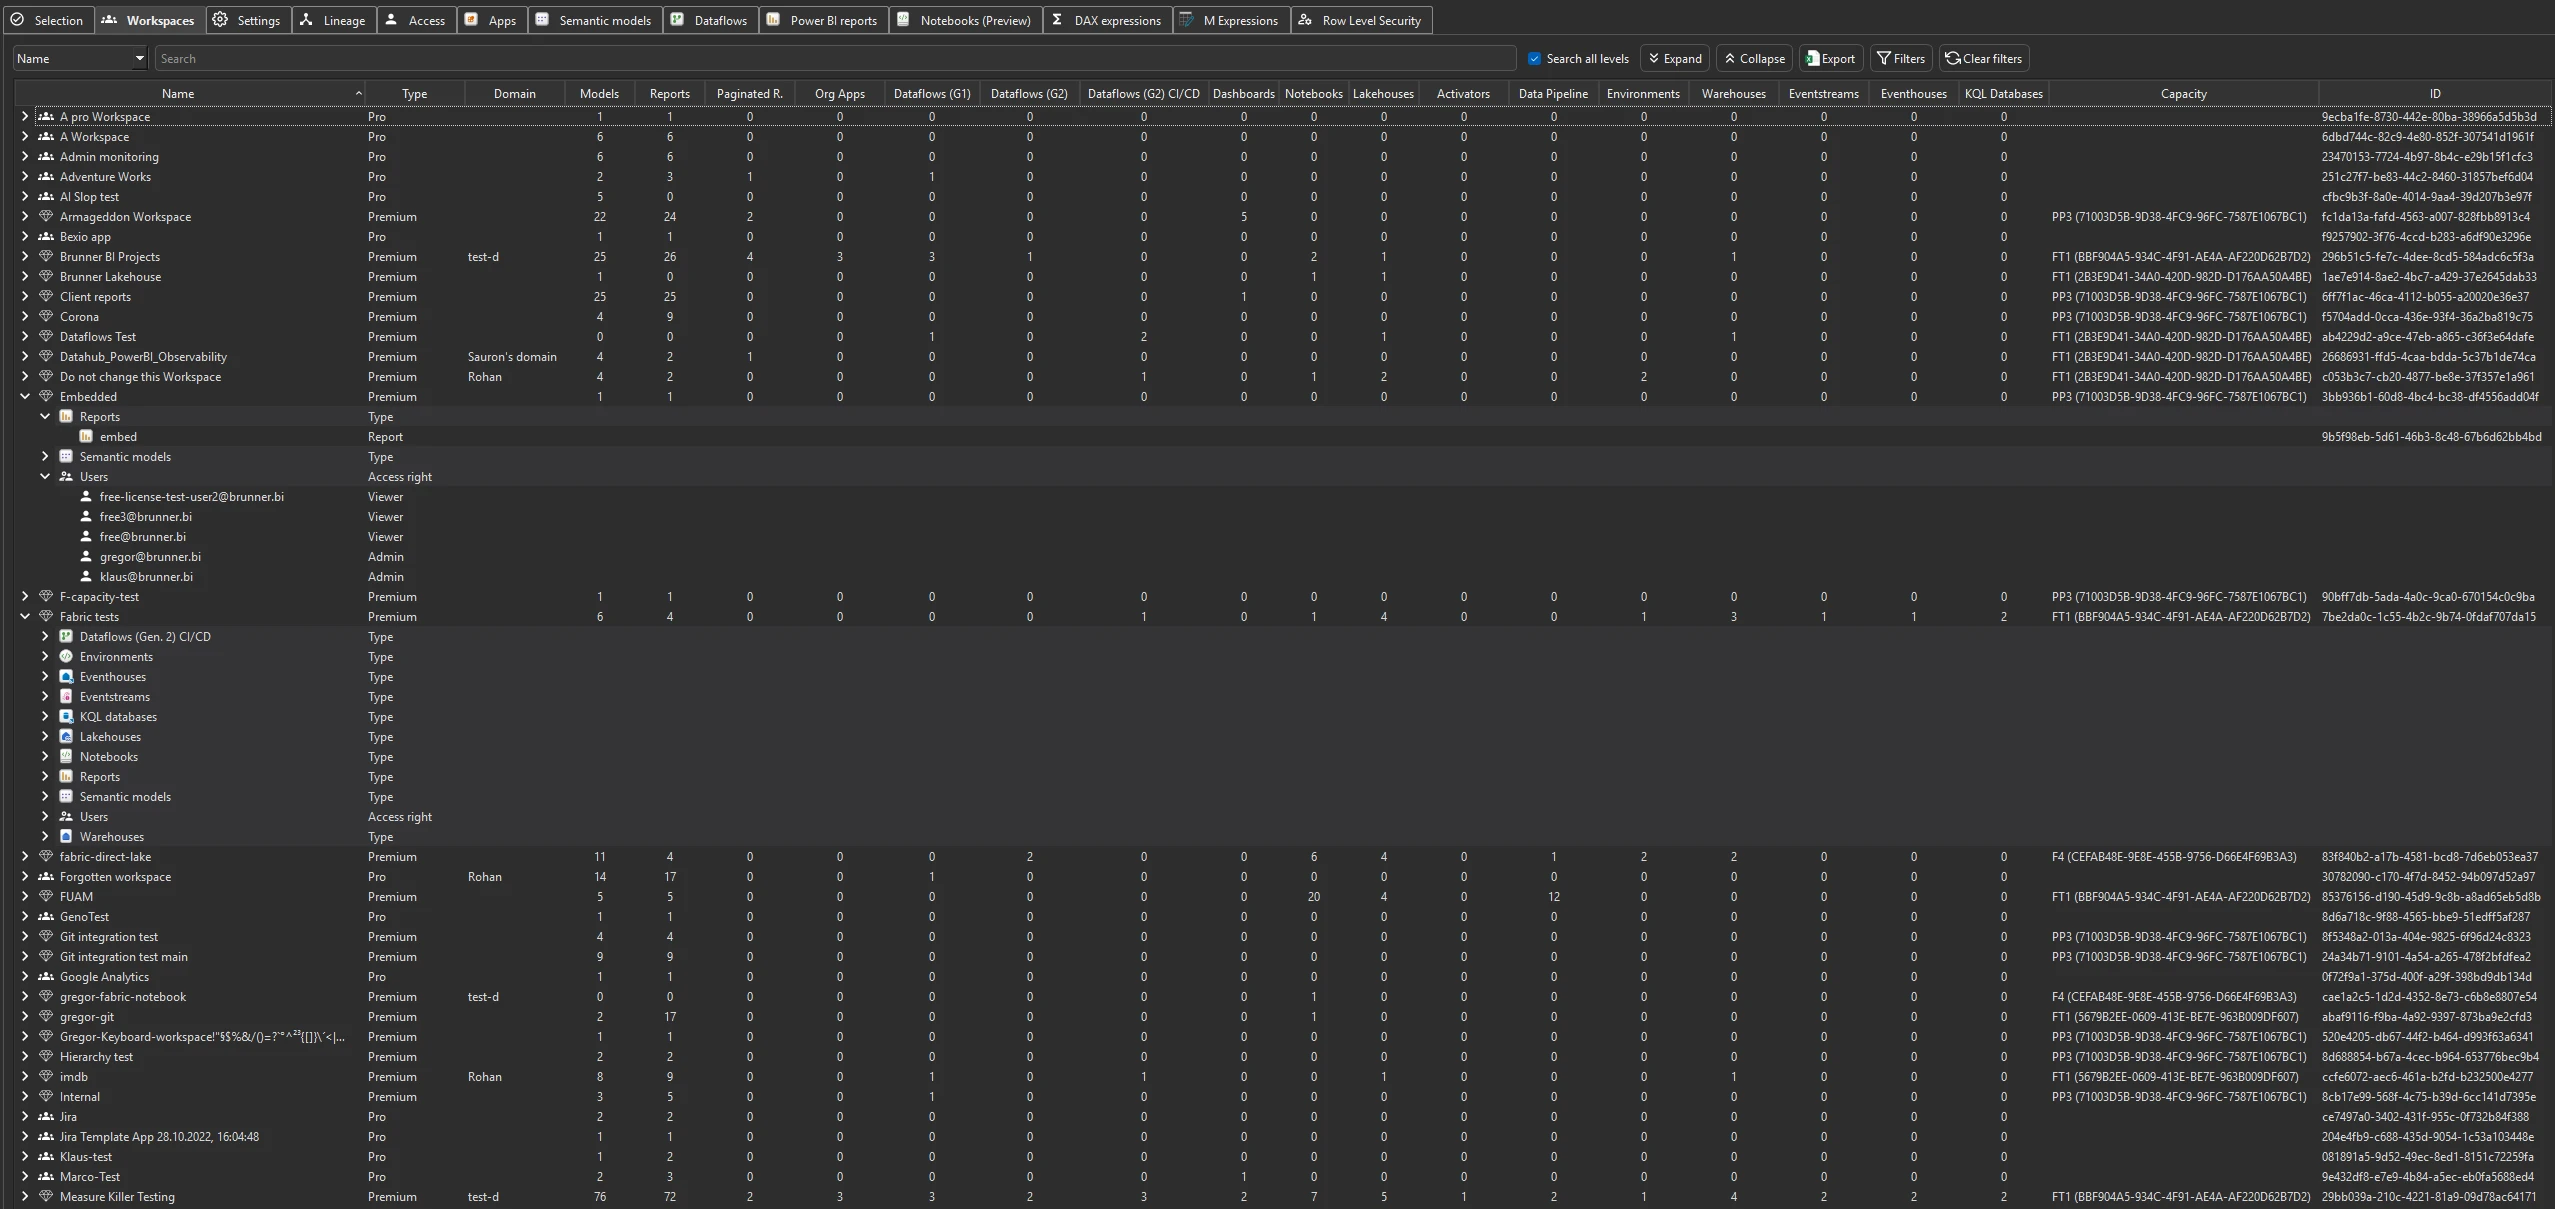
Workspaces
A detailed inventory of every workspace in scope — same workspaces as the Selection tab but with different columns focused on governance: owners, users, creation date, last activity, workspace state, and capacity assignment. Selection is for picking what to scan; Workspaces is for reviewing the inventory after scanning. See Workspaces inventory.
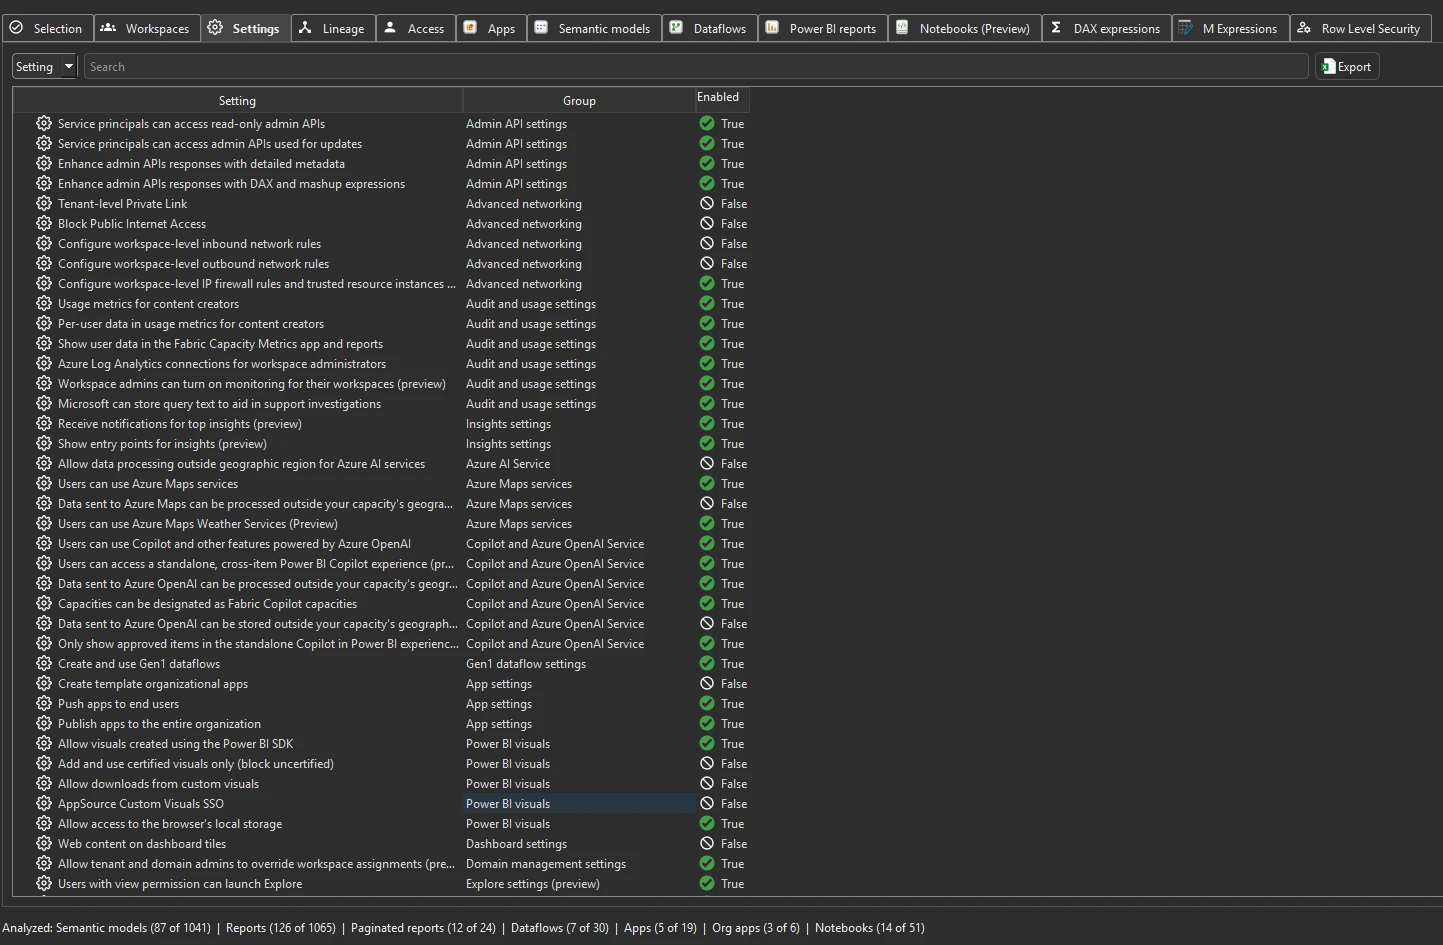
Settings
Tenant-level Power BI and Fabric admin settings pulled from the admin API. Shows every tenant setting configured in the Power BI admin portal — export policies, sharing policies, developer settings, capacity assignments, embed settings, and more. This gives you a snapshot of how the tenant is configured without opening the admin portal. For a setting scoped to specific groups, expand its row to see the Enabled Security Groups — each group with its Graph ID (new in v2.9.5). See Tenant settings audit.
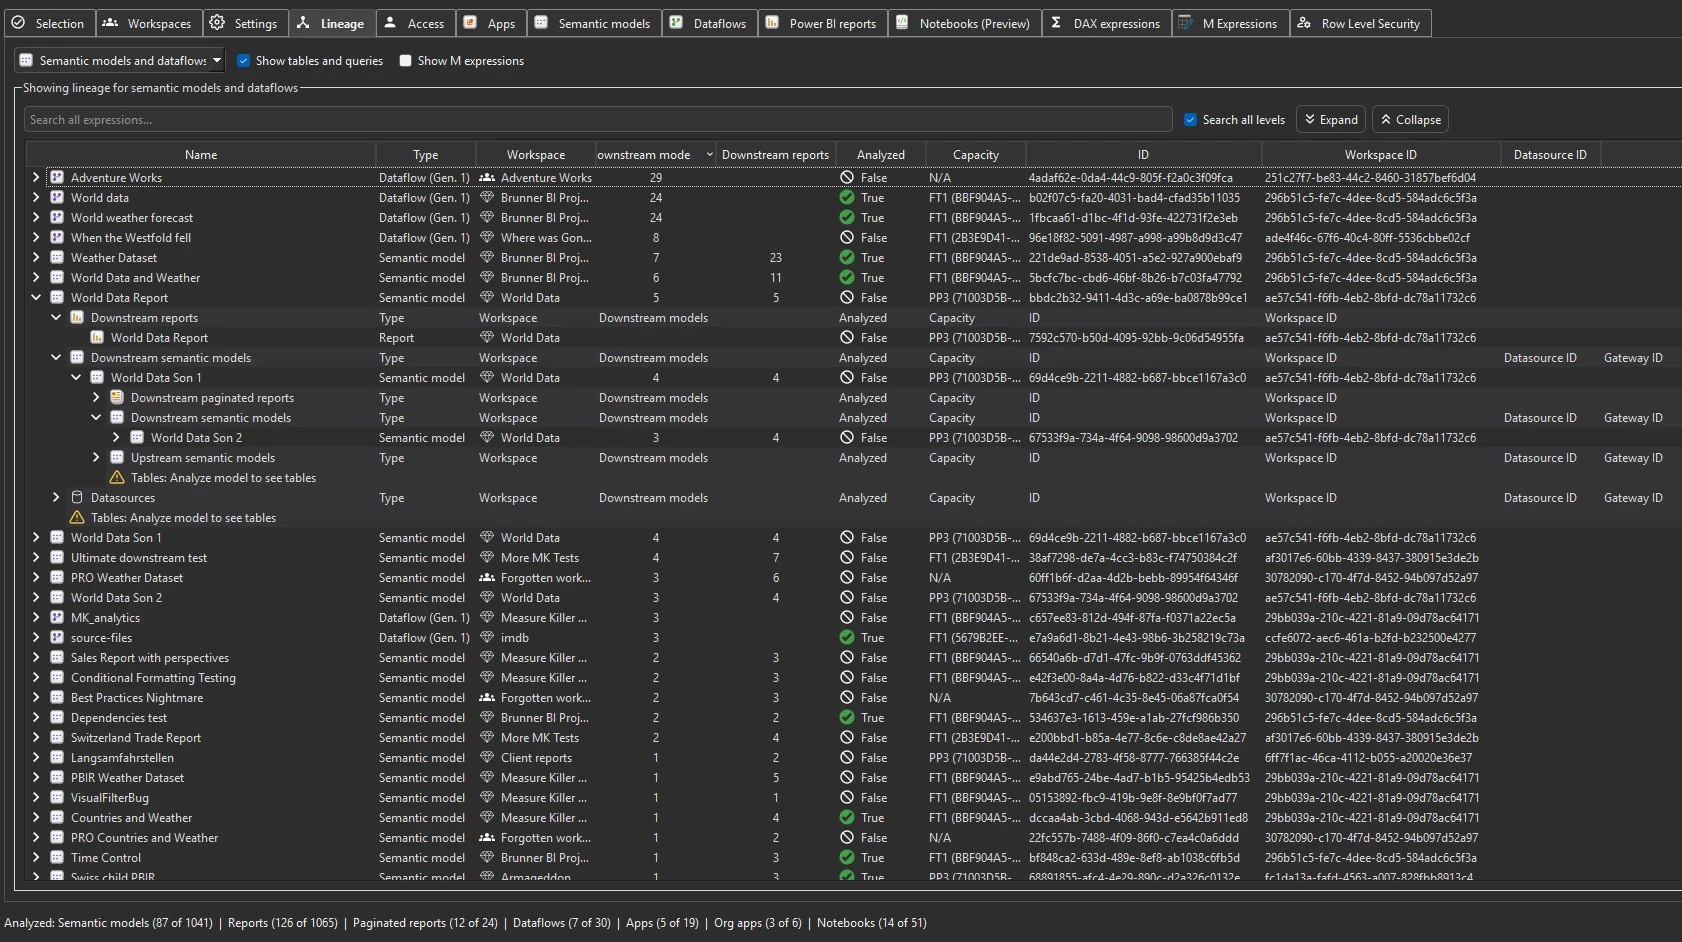
Lineage
End-to-end lineage at the item level — from data sources through semantic models and dataflows down to every connected Power BI report, paginated report, Excel consumer, and downstream semantic model. A dropdown in the top-left corner switches between two views. See End-to-end data lineage in Power BI for the walkthrough and workflows.
Data sources — starts from every data source and traces downstream: which semantic models and reports depend on it.
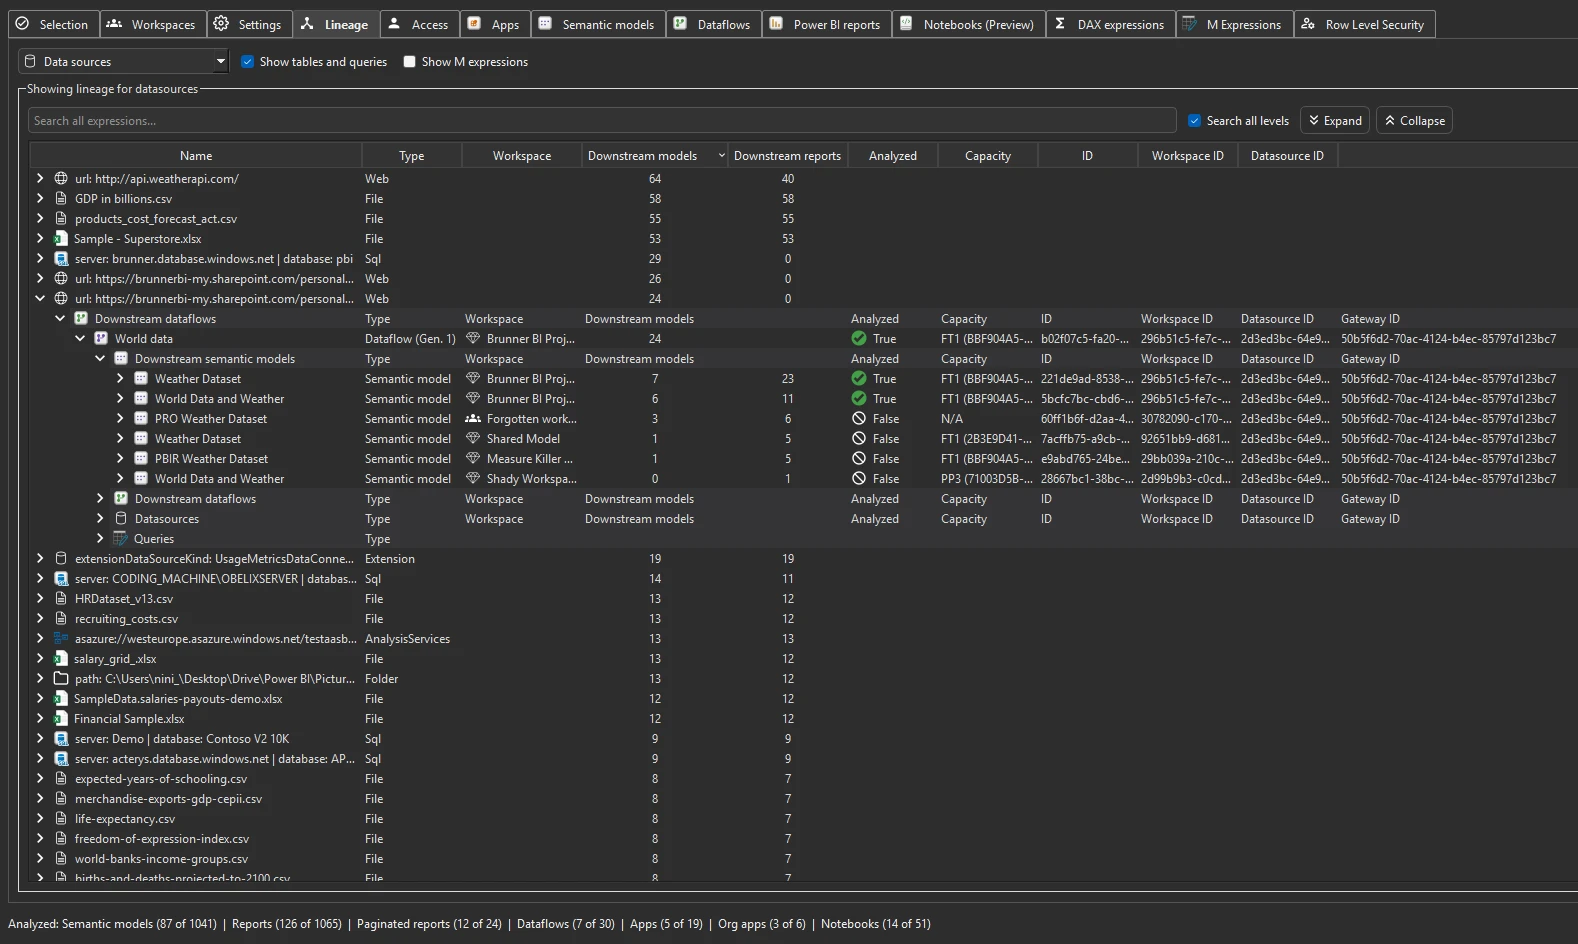
Models and dataflows — starts from every semantic model and dataflow and shows both directions: upstream sources that feed into it and downstream reports, Excel files, and chained models that consume it.
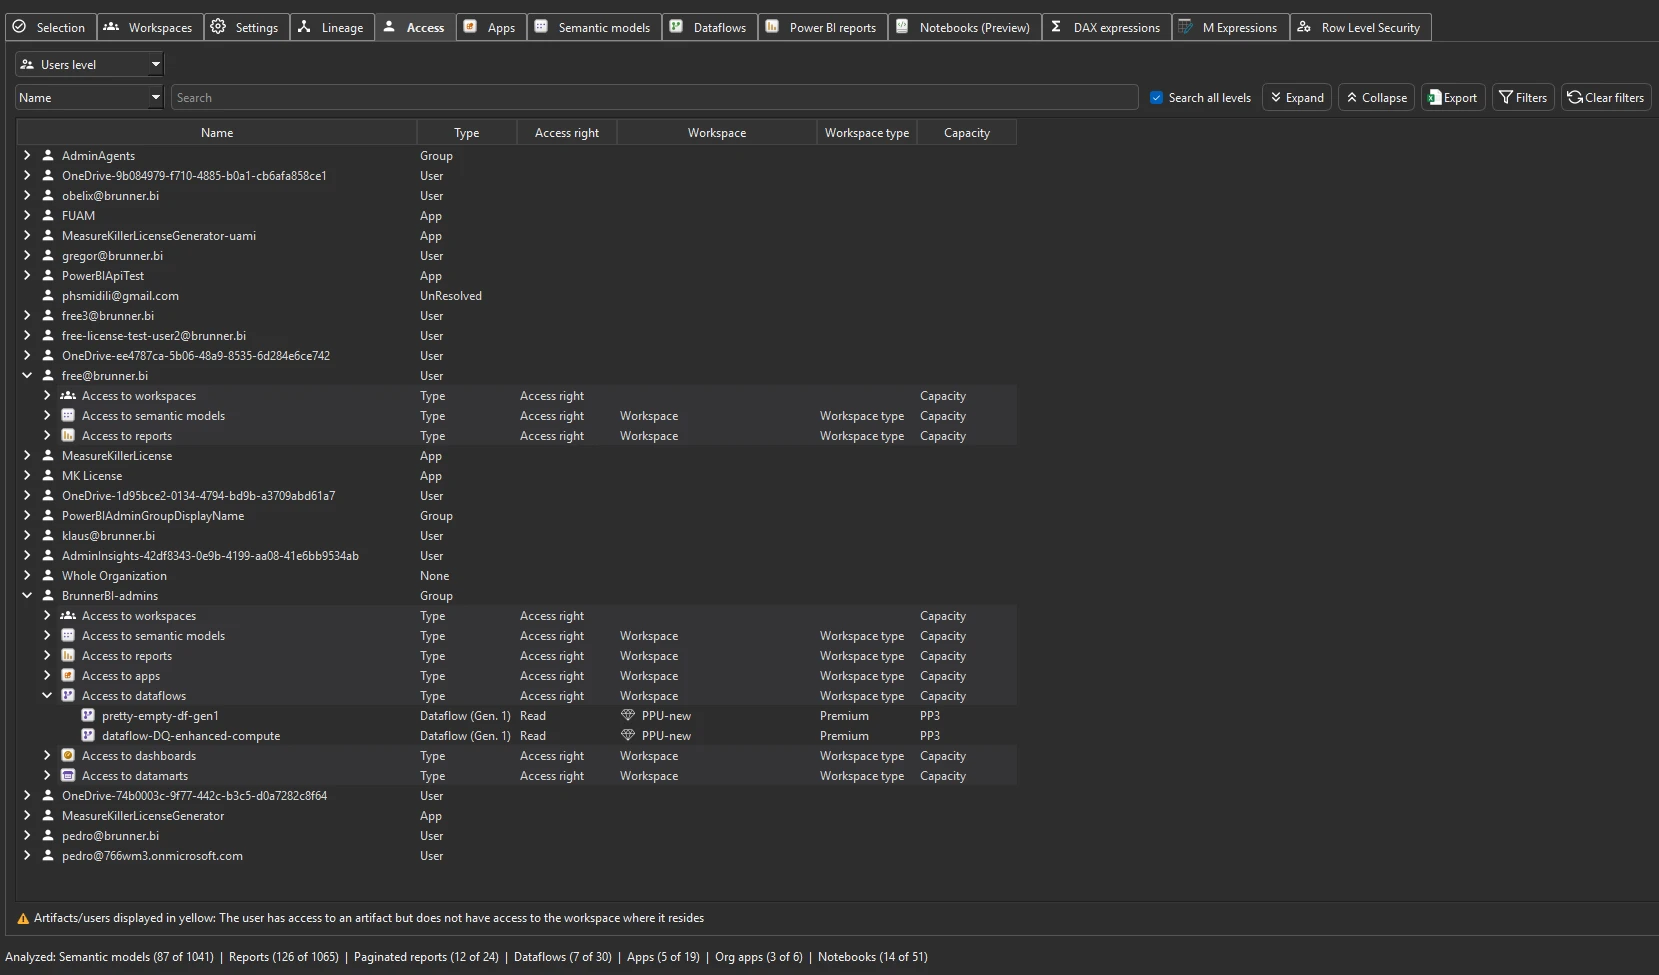
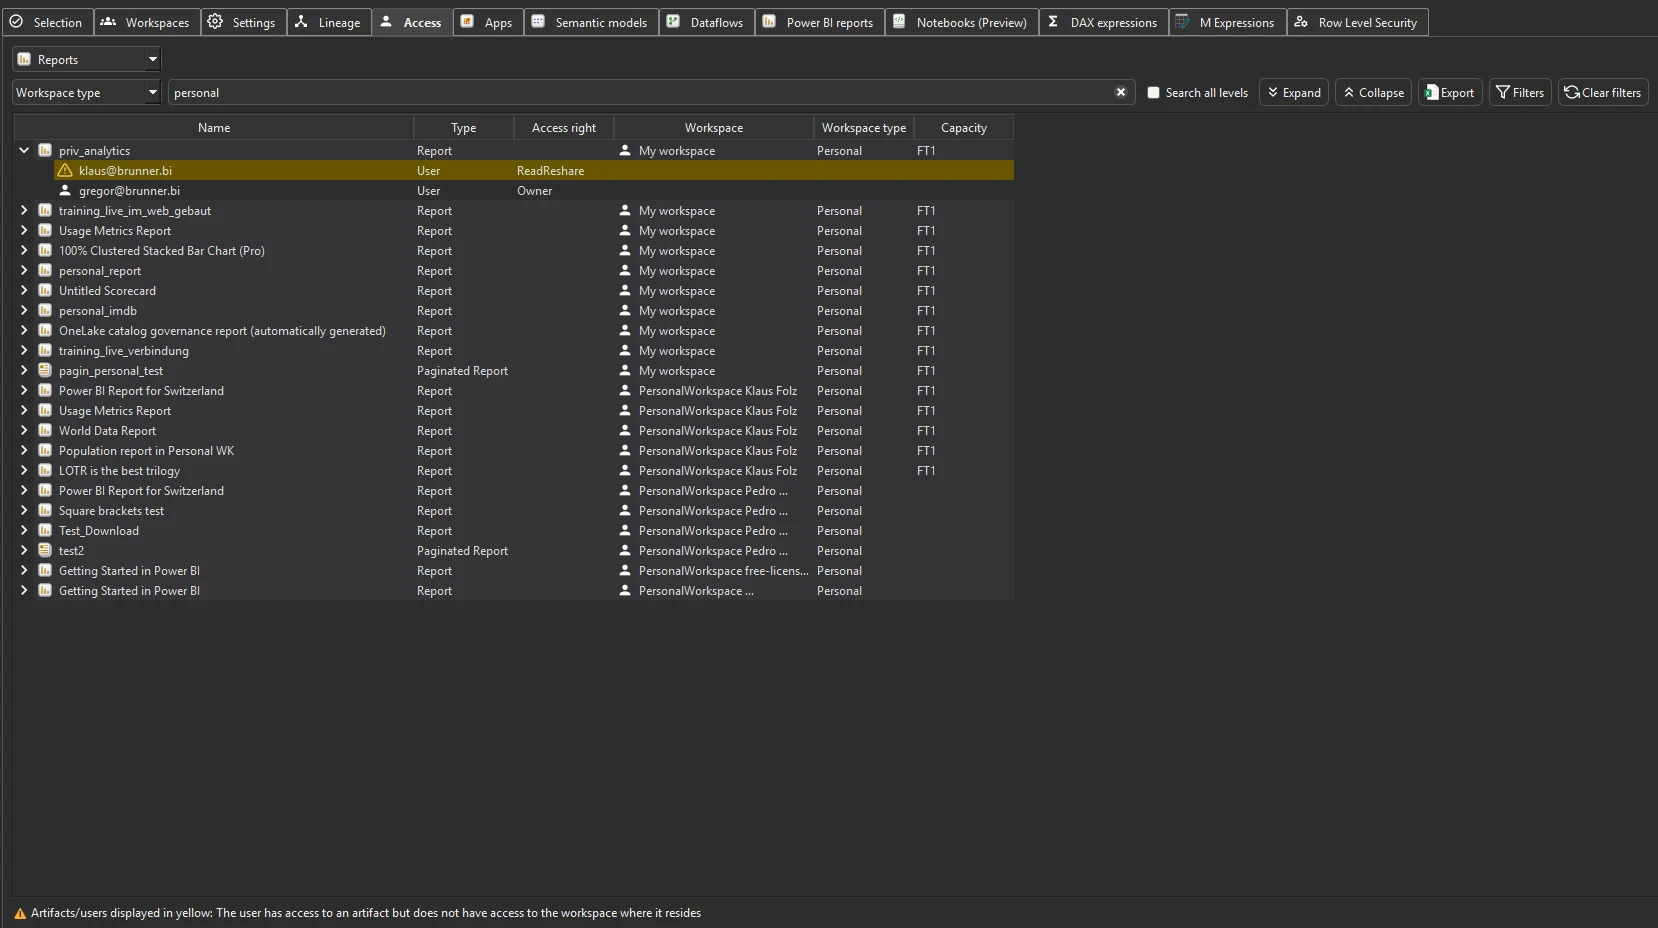
Access
Who can access which workspace and item — every principal (user, security group, service principal) with their role on each workspace and on individual items. Full Tenant Analysis only — this tab is not present in Limited Tenant Analysis. See Access & permissions tracking. To change access rather than audit it, use Workspace access (admins only).
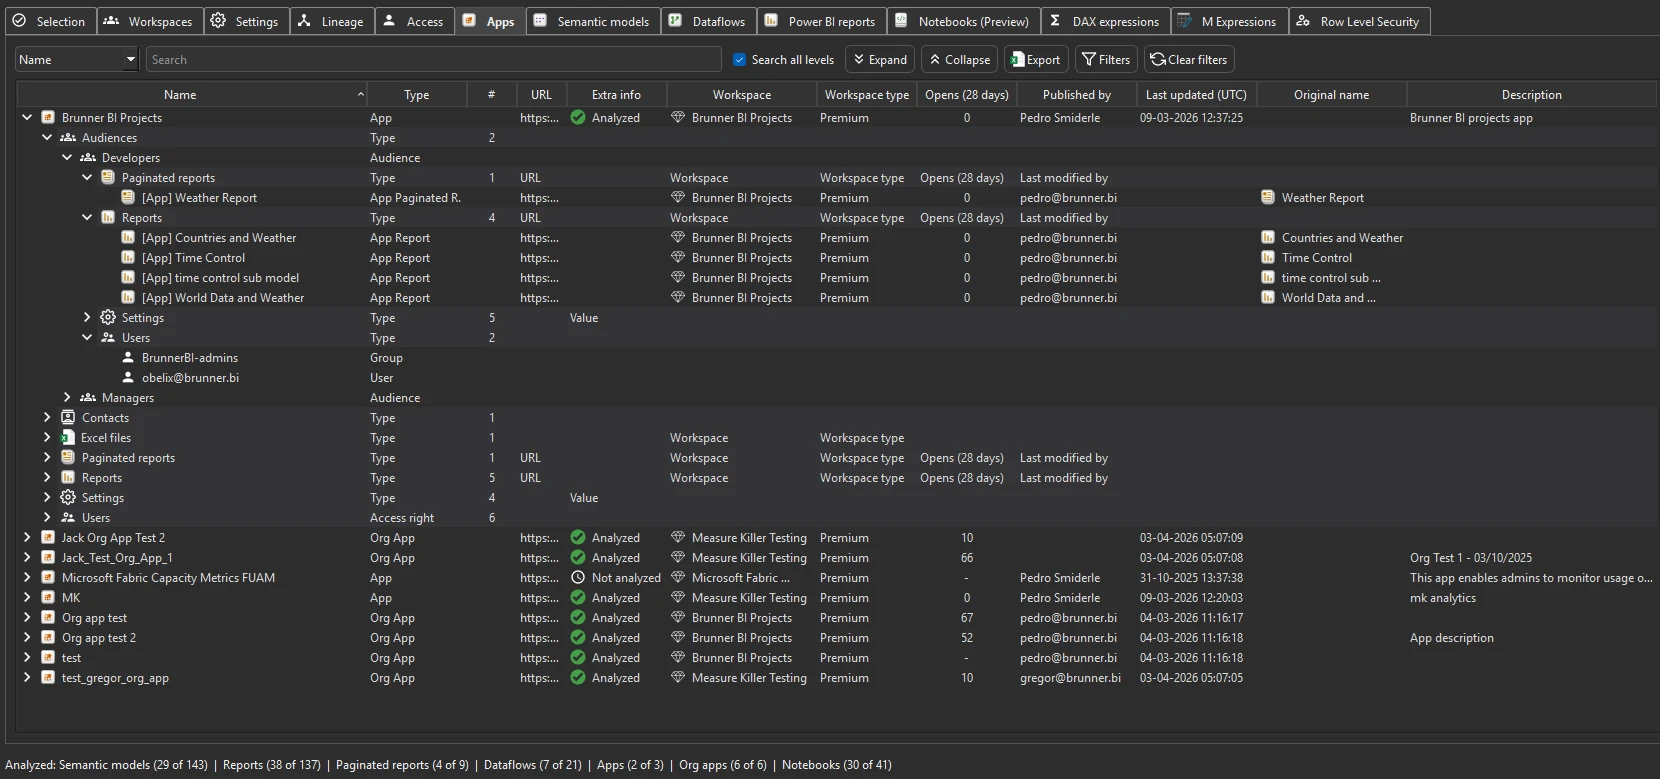
Apps
Every Power BI app in the tenant — including organizational apps — with the workspaces each app publishes from, the audiences defined inside each app, 28-day consumption data (opens), contact information, and the users/groups who can access each audience. Useful for understanding app adoption and for license-compliance audits (who is consuming which content through which app). See Apps & audiences.
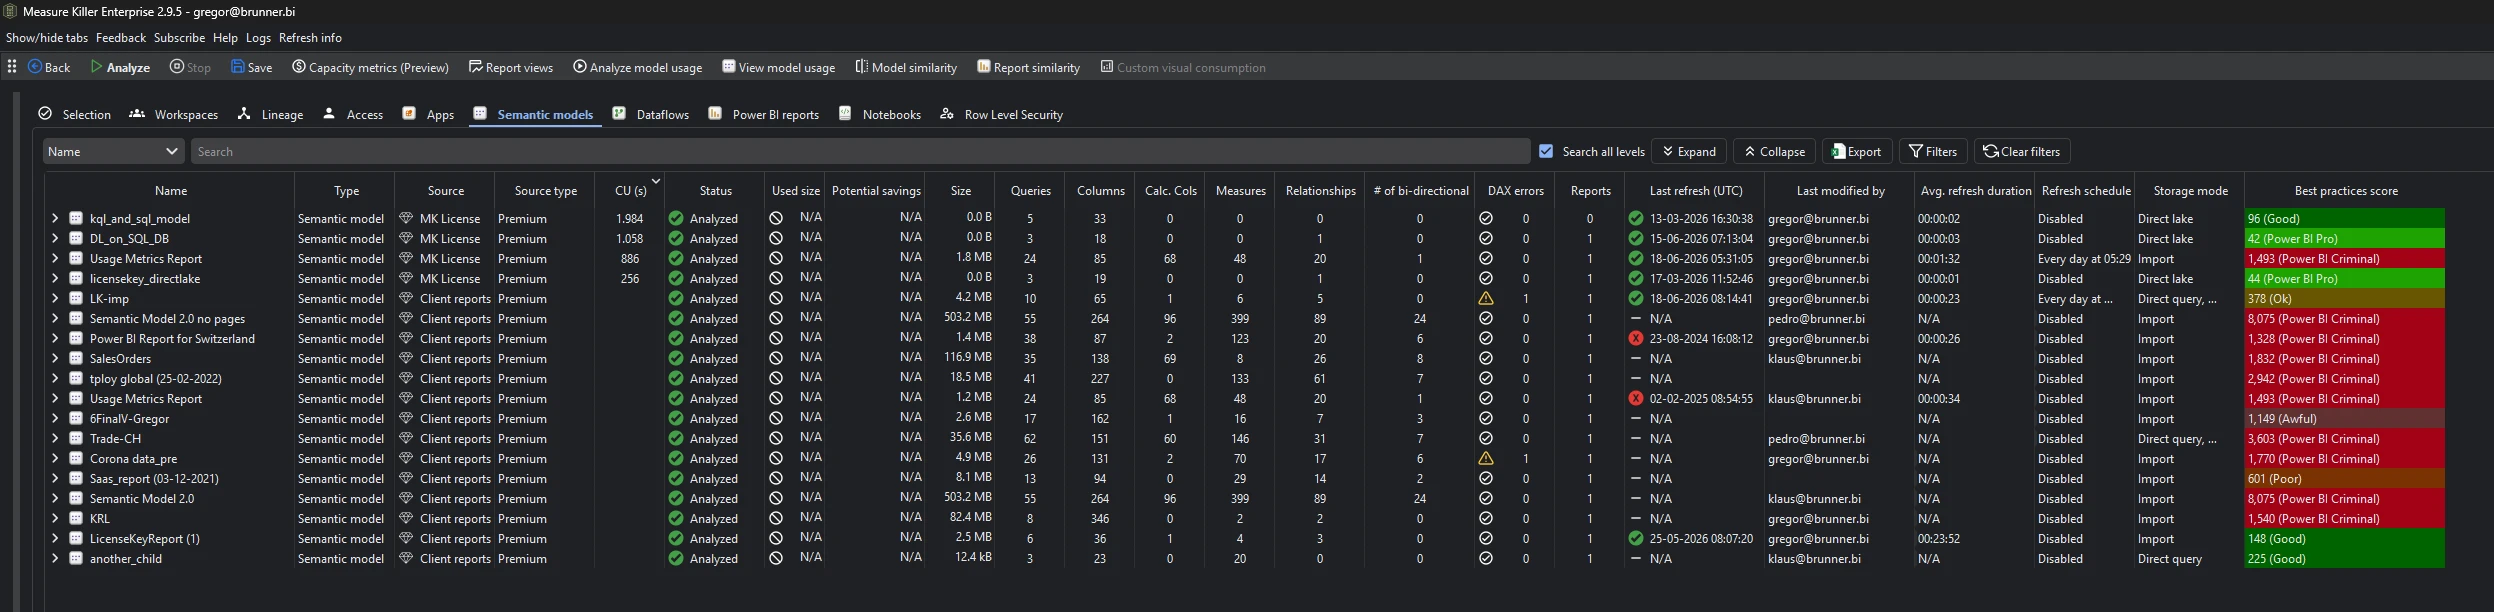
Semantic models
Every semantic model from the scan, with columns for:
- Name and workspace
- Size — the in-memory model size
- Used size / Potential savings — populated after running Analyze model usage (Phase 3)
- Queries, Columns, Calc. Cols, Measures, Relationships, # of bi-directional — object counts, including how many relationships are bi-directional
- Last refresh (UTC) — timestamp and success/failure status
- Last modified by — who last changed the model
- Avg. refresh duration — average refresh time
- Storage mode — Import, DirectQuery, Direct Lake, composite
- Best practices score — the model’s governance score from the best-practice analysis
- CUs (new in v2.9.5) — the model’s Capacity Unit consumption, populated after fetching Capacity metrics
- # of DAX errors (new in v2.9.5) — how many DAX expressions in the model currently contain errors
Expand any model to drill into its tables, queries (incl. unloaded / auto date tables), relationships, and connected reports. The search bar (Search all levels on by default) filters to just the models containing your term. Right-click a model for View end-to-end lineage, View refresh events, or Best practices (its full list of violations with details). After Phase 3, sort by Potential savings to find the biggest cleanup wins. See Semantic models inventory.
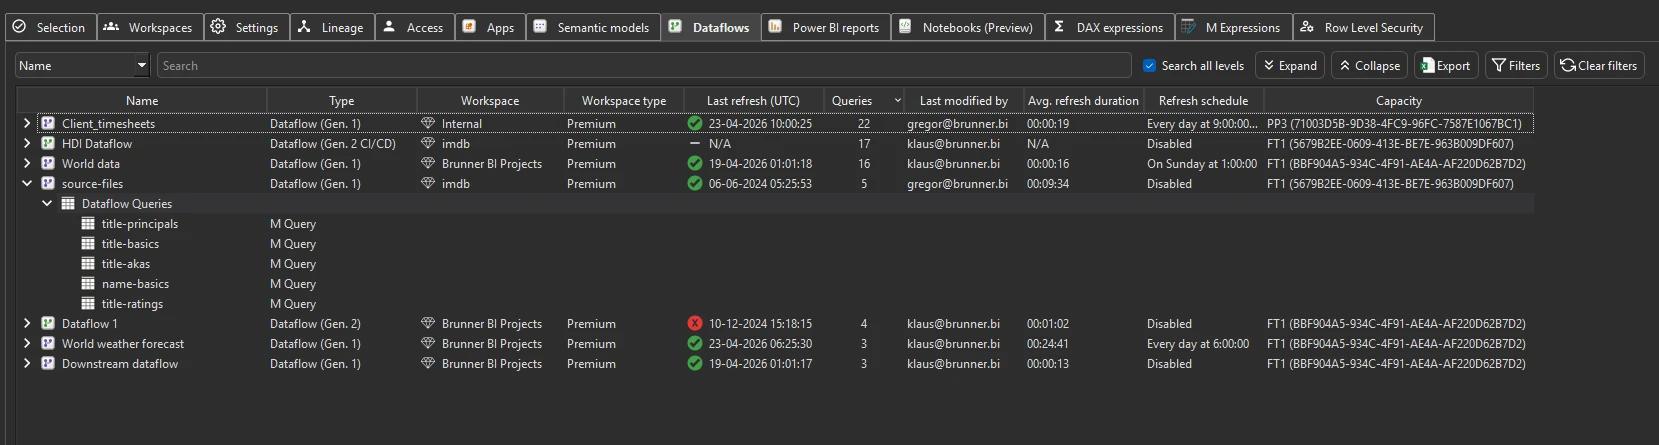
Dataflows
Every dataflow (Gen1 and Gen2) from the scan — type, workspace and workspace type, last refresh (UTC) with status, queries, last modified by, average refresh duration, refresh schedule, and capacity, plus the full M/Power Query code. Searchable across all M expressions — useful for finding which dataflows reference a specific data source or table. Right-click a dataflow and choose View end-to-end lineage to see its upstream sources and downstream models. See Dataflows inventory.
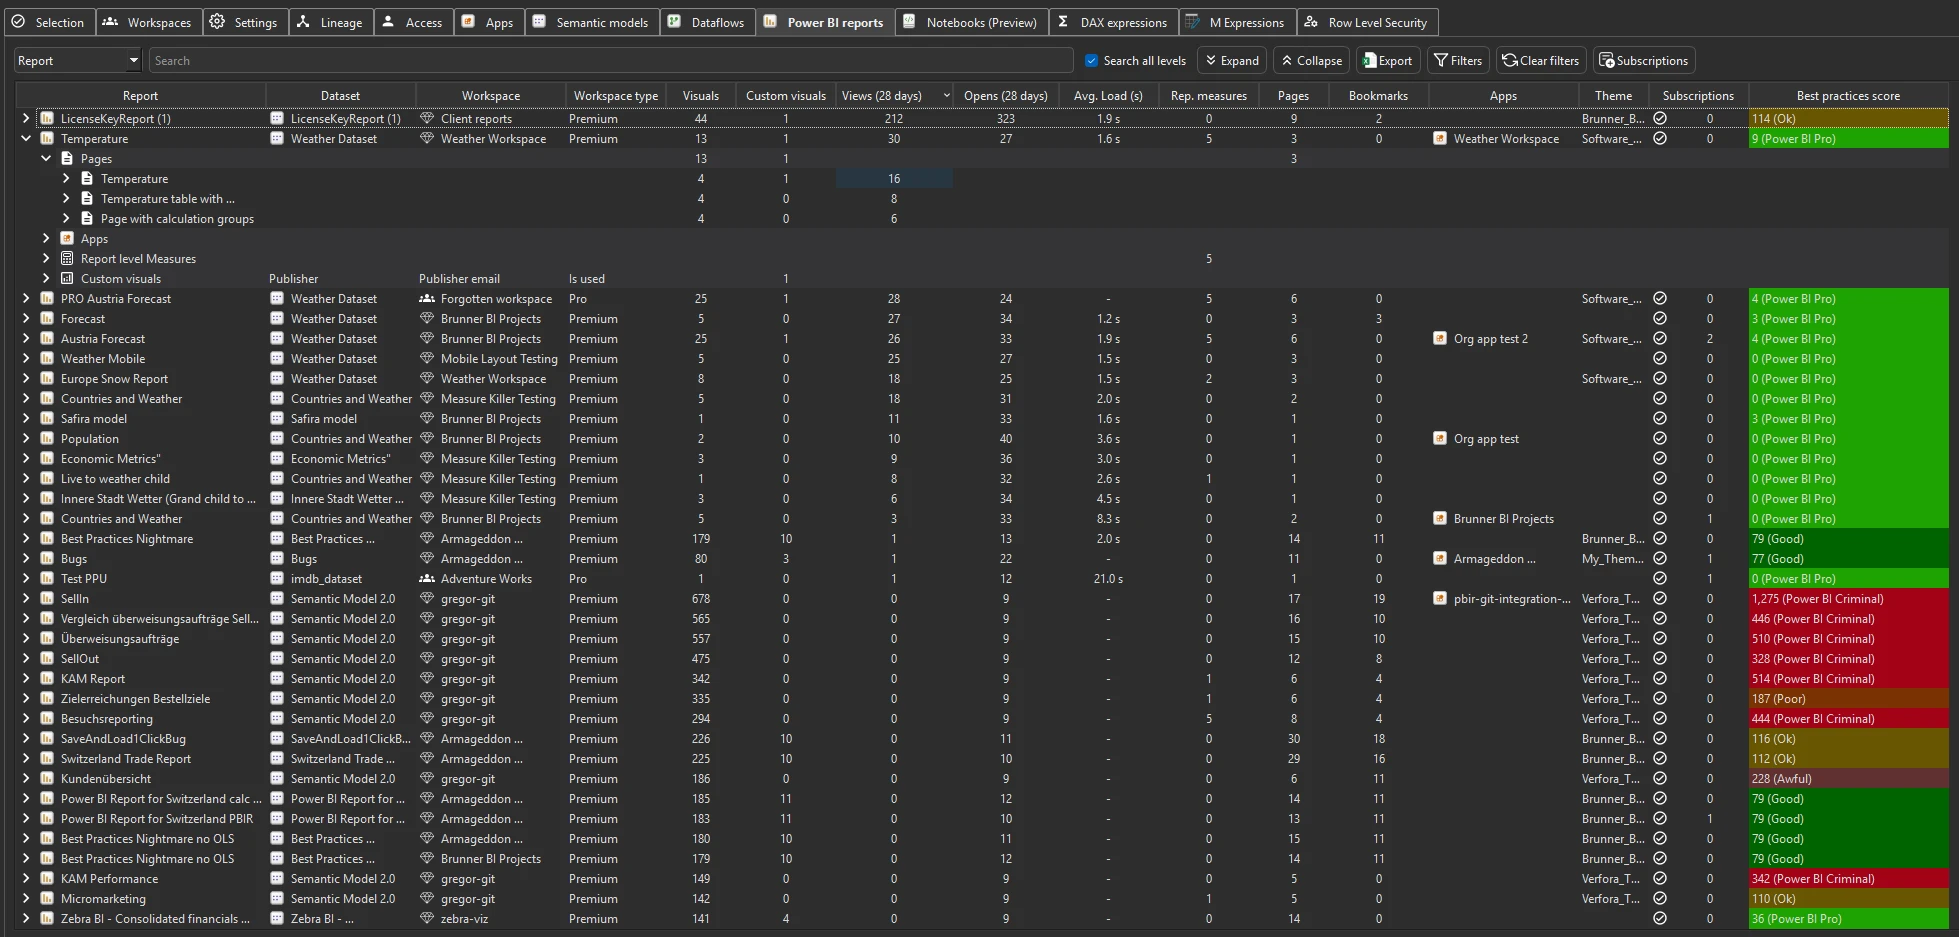
Power BI reports
Every Power BI report scanned, with columns for:
- Name and workspace
- Connected semantic model — which model the report reads from (see Semantic models)
- Page count — number of pages in the report
- Owner / last modified by
- Opens and Views — 28-day consumption, auto-fetched when the page-views toggle was on (not from the Activity logs action). Opens = report open events; Views = the report’s aggregated page views (see Report views & opens)
- Average load time — how long the report takes to render (see Report load times)
- Custom visuals — count of certified vs. non-certified custom visuals (see Custom visual consumption)
- Report-level measures — count of measures defined at the report level (rather than in the model)
- Report subscriptions — the Subscriptions button opens a tenant-wide list of every subscription, its owner and recipients. See Report subscriptions
- Broken visuals (new in v2.9.5) — how many visuals in the report currently render an error instead of data, drillable per page and per visual. Shows N/A (no count available, not zero) until Analyze model usage (Phase 3) has run on the report’s semantic model — or when an error occurred while processing the model or the report. Right-click a report or page for View broken visuals — the detail list shows each broken visual with the reason (missing artifact, broken DAX, broken visual-level filter). See Find broken visuals
See Power BI reports inventory.
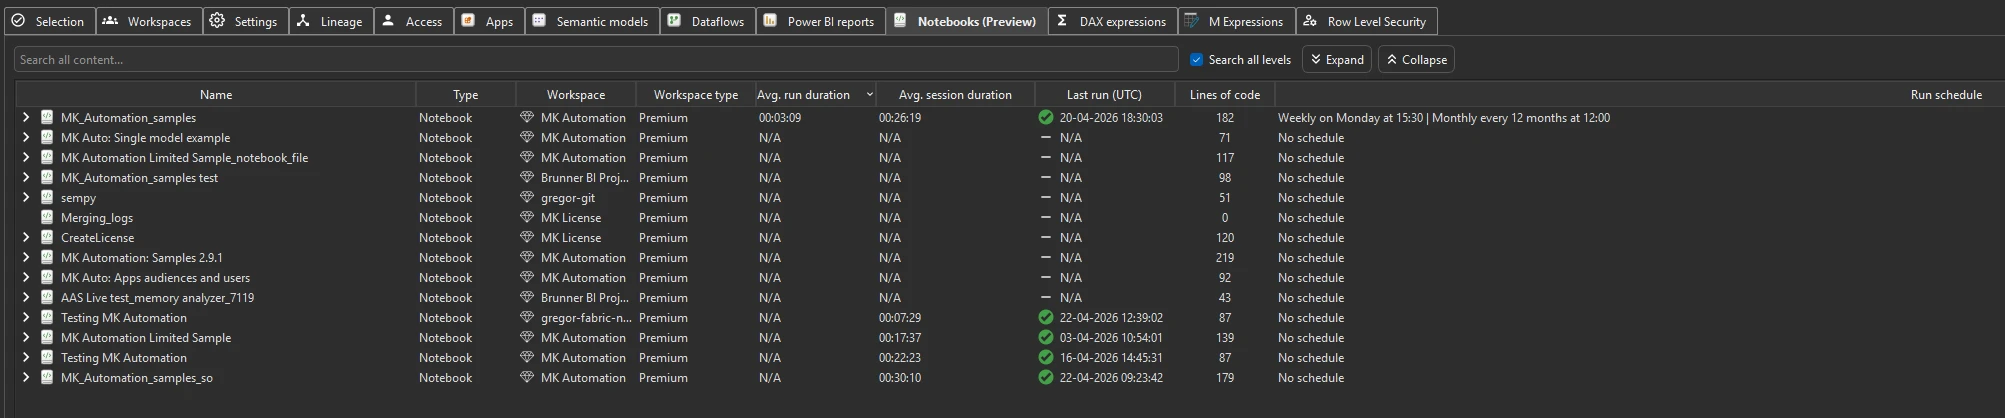
Notebooks
Fabric notebooks across the tenant — workspace and workspace type, average run and session durations, last run (UTC) with success/failure status, run schedule, and lines of code per notebook. Searchable across all notebook content — useful for finding which notebooks reference specific packages, libraries, or keywords. See Fabric notebooks inventory.
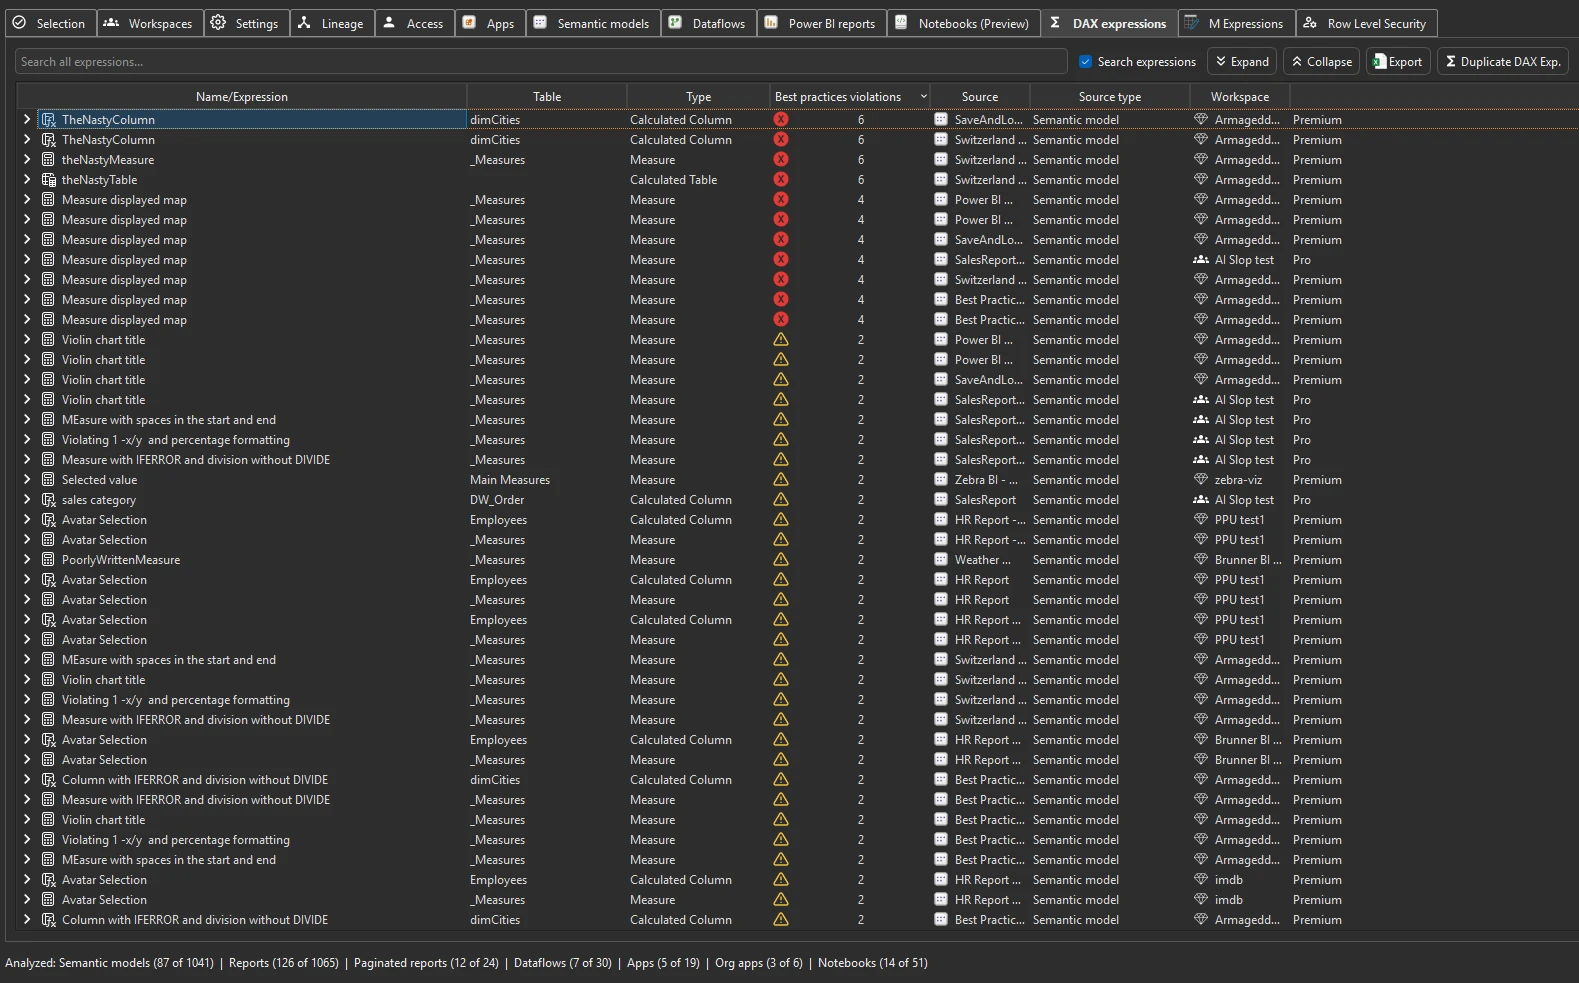
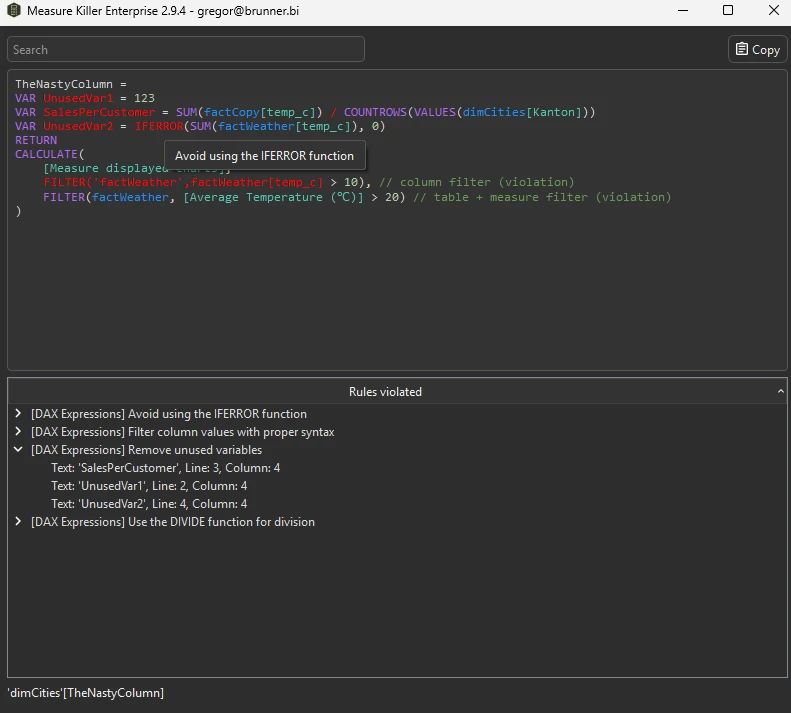
DAX expressions
Every DAX measure, calculated column, and calculated table expression
from every scanned semantic model — browsable and filterable. Use the
search bar to find specific function calls (e.g. USERELATIONSHIP),
table references, or variable names across the entire tenant’s DAX
codebase in seconds. See
DAX expressions.
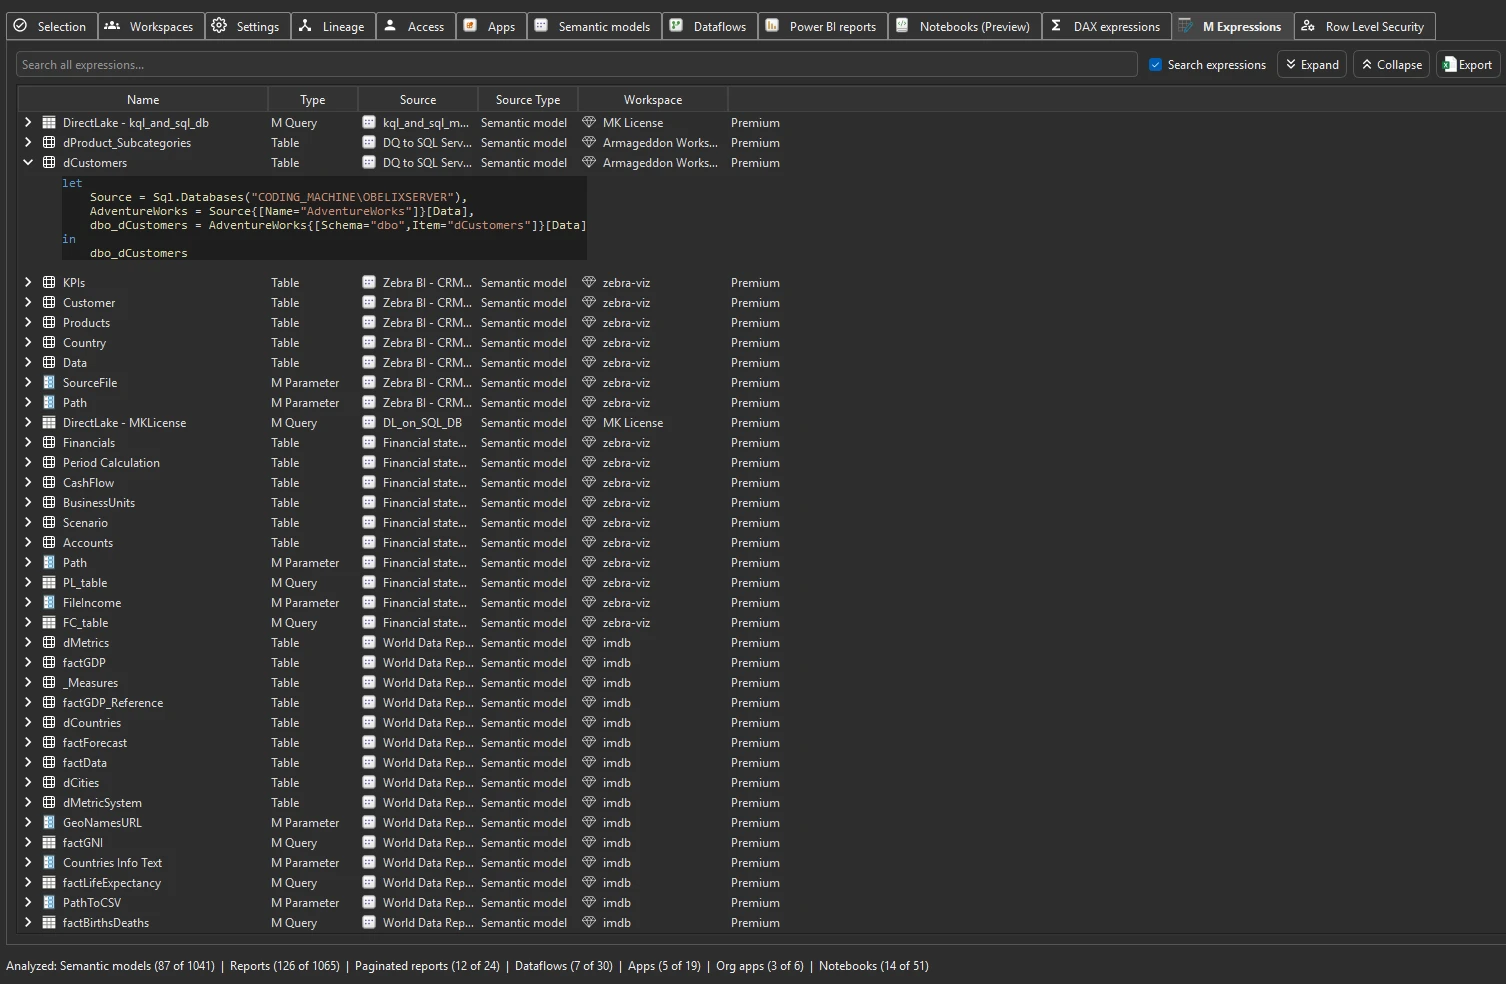
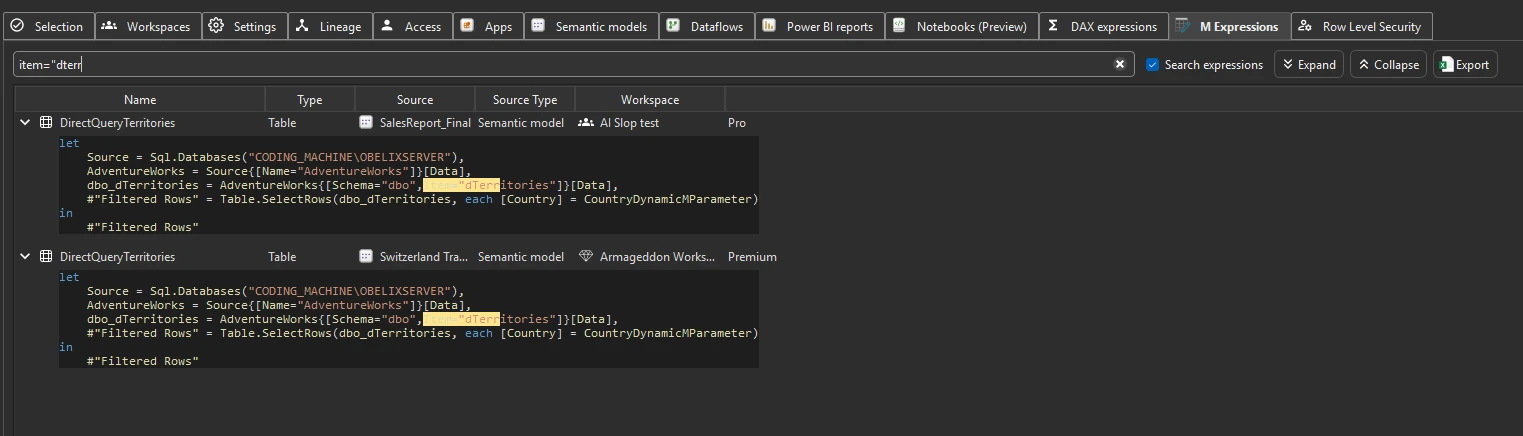
M Expressions
Every M / Power Query expression from every scanned semantic model and dataflow — browsable and filterable. Search for specific data source references, table names, transformation functions, or connection strings across all models and dataflows in the tenant. See M Expressions.
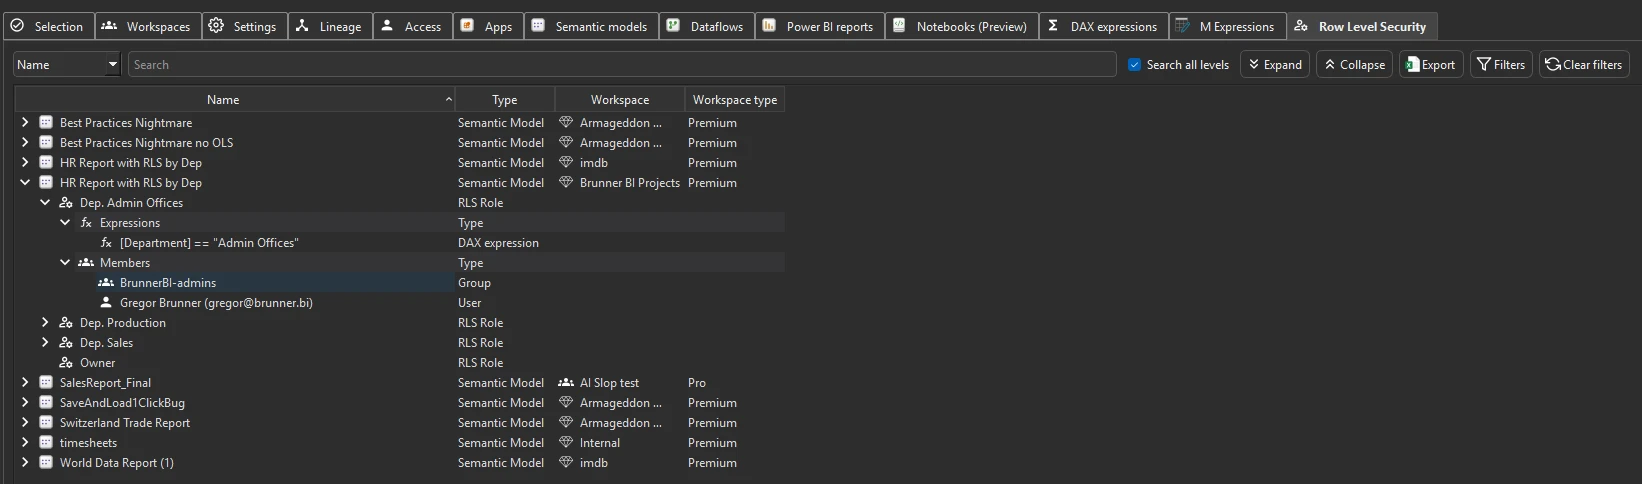
Row Level Security
Every RLS role in every scanned model, the DAX filter expression behind it, and the principals (users, security groups) assigned to each. See Row-level security (RLS).
Top toolbar — actions
The toolbar above the tabs has buttons for running the scan and launching the cross-scan analyses.
Back
Return to the workspace / dataset picker before the scan — useful if you want to change the scope and re-run without quitting Measure Killer.
Analyze
Kick off the scan with the current selection / filters.
Stop
Cancel an in-progress scan.
Save
Writes the current scan state to a .measurekiller file on disk
— every workspace, item, and bit of metadata Measure Killer has
fetched so far. Open the file later (or share it with a colleague)
and every populated tab is restored exactly as it was, with no
re-fetch needed.
This is the foundation for the “incremental scan” pattern on large tenants: scan a batch, Save, come back tomorrow, Load, scan the next batch, Save again. See Resume an interrupted scan.
The file is also useful for handoff — a colleague without your admin
rights can open the saved .measurekiller and see exactly the same
data, since the scan results travel with the file.
Activity logs
Pull Fabric activity logs for a date range you specify, then drill into
who did what — refreshes, Excel connections, Analyze-in-Excel sessions,
report opens, and report data exports (the ExportReport activity).
You can select which activity types to fetch (e.g. only
Excel activities or only connection activities) — fetching fewer types
speeds up the scan on large tenants. Activity-log API is admin-only
(28-day window, with a local SQLite database in %APPDATA% extending
history beyond that — each scan merges fresh results with what’s
already stored). See
Identify Excel users and
Report data exports.
Report views
Opens, views, and average load times over the last 28 days. Shows open counts per report plus page-level page views, so you can identify which reports and pages are actually being used — and which have zero consumption. This is the same data that auto-populates the Opens, Views, and Average load time columns on the Power BI reports tab when the page-views toggle is on — it is not pulled from the Activity logs action. It also feeds the Clean your model suggestions for reports and pages without recent consumption (suggestions 8 and 9).
Opens, page views, and average load times are stored in the local
SQLite database in %APPDATA% — each scan merges fresh data with
what’s already there, so your history accumulates beyond the 28-day API
window. See
Report views & opens for the
full walkthrough on building long-term consumption history and
exporting page-level data.
Capacity metrics
(New in v2.9.5.) Opens the Capacity metrics window, which fetches
Capacity Unit (CU) consumption for the Fabric / Premium capacities in
scope. It has its own Fetch data step (the CU data comes from a
different API than the rest of the scan), a View data tab with the
per-capacity → workspace → item type → item → operation breakdown, and
an Instructions tab. Needs Capacity Admin on the capacity — not
full tenant admin. Fetching also populates the CUs column in the
Semantic models tab, so each model’s consumption
shows up right in the inventory. Like activity logs and Report views data, results merge
into the local SQLite database in %APPDATA%, so history accumulates
beyond Microsoft’s 14-day window. See
Capacity metrics for the full
walkthrough.
Workspace access
A bulk workspace-access action, available to tenant / Fabric admins only. Unlike the Access tab (a read-only audit of existing permissions), the Workspace access window changes permissions: pick Add access or Remove access, choose a User (by email) or an AD Group, set the workspace role when adding (Admin, Member, Contributor, or Viewer), select one or more workspaces, and Execute — Measure Killer calls the admin API to apply the change in one operation (up to 200 workspaces per hour). See Grant or remove workspace access in bulk.
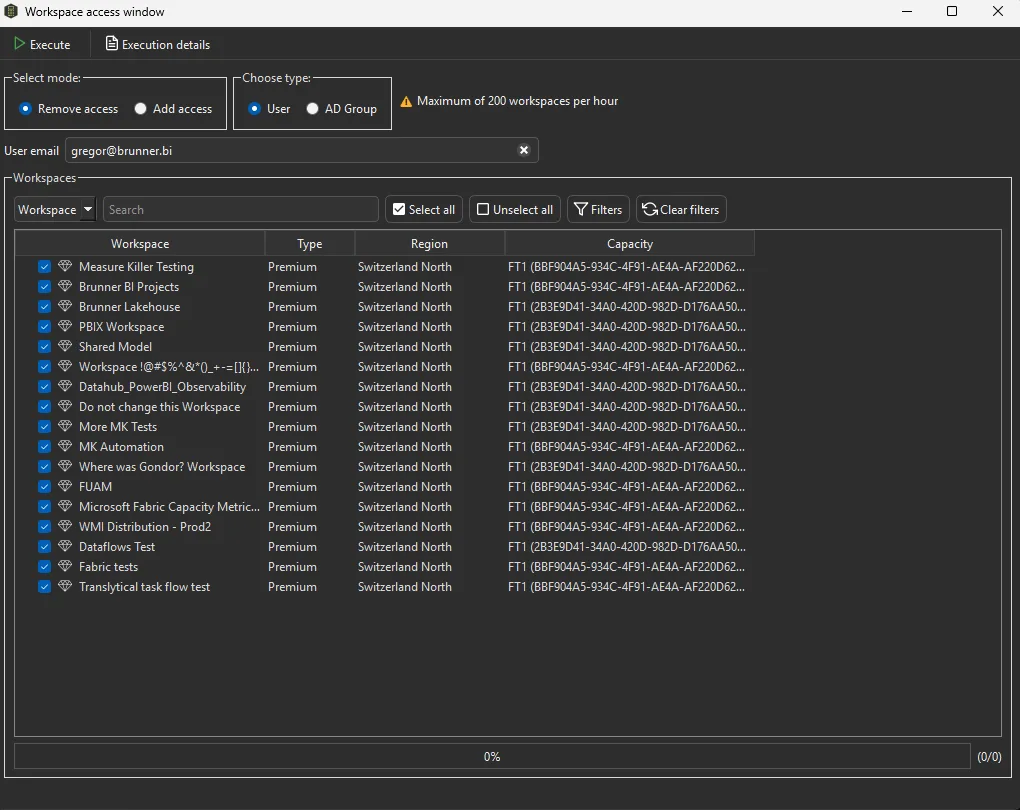
Remove access
The Remove access mode of the Workspace access window (above) — bulk-revoke a user or AD group from the selected workspaces. There is no automatic rollback, so if you remove someone by mistake, re-add them with Add access.
Analyze model usage
Runs the core Measure Killer used/unused analysis across every scanned semantic model in the tenant — locally, on the metadata Phase 2 already pulled, with no extra API calls. This is the tenant-scale equivalent of the Clean your model tab from the single-model scan: once it finishes, every semantic model gets a % unused figure and an estimated size that can be freed, both surfaced in the Semantic models tab. Sort by either column to spot the biggest cleanup wins across the tenant.
This is Phase 3 of a tenant scan — see Run a tenant-wide scan → Phase 3.
View model usage
Drills into a single semantic model at a time to see the full per-column / per-measure where-used detail — the same level of metadata a single-model online scan produces, but for any model already pulled into the tenant scan. Run Analyze model usage first to get the tenant-wide % unused / freeable size summary, then View model usage to drill into whichever model you want to clean up.
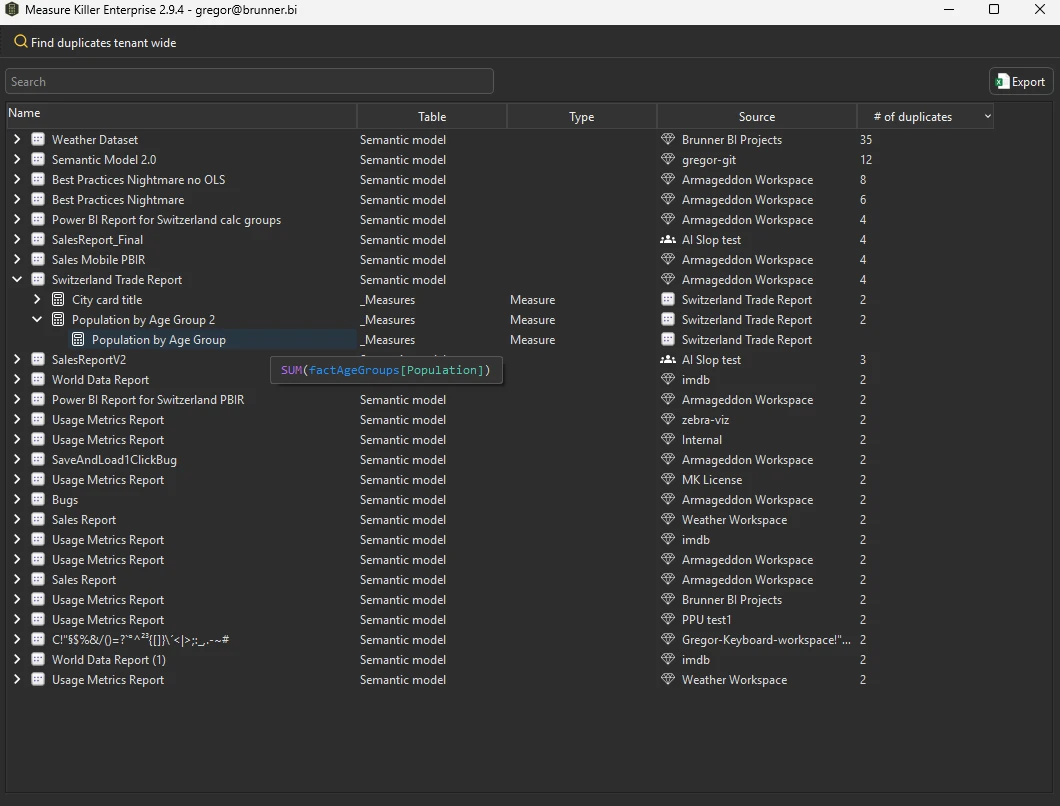
Model similarity
Compute similarity scores across every scanned semantic model — table / column / measure / relationship overlap — and surface duplicates and near-duplicates worth consolidating. See Semantic model similarity score.
Report similarity
Same concept as Model similarity but applied to Power BI reports. Compares reports across pages, visuals, filters, bookmarks, report-level measures, custom visuals, and mobile layouts. Each pair gets a similarity score — the higher the score, the more likely the reports are duplicates or near-duplicates worth consolidating. See Report similarity score.
Custom visual consumption
Lists every custom (non-Microsoft) visual in use across the scanned tenant — which visual, which reports use it, how many instances, and which users have built or consumed reports containing it. Useful for license-compliance checks (some custom visuals require per-user licenses), for identifying deprecated or unsupported visuals before Microsoft removes them, and for standardizing which visuals your organization allows.
Exports overview
The Exports sidebar (left side, second tab) writes raw JSON files you can hand to a downstream tool — your data warehouse, a governance dashboard, or an AI model.
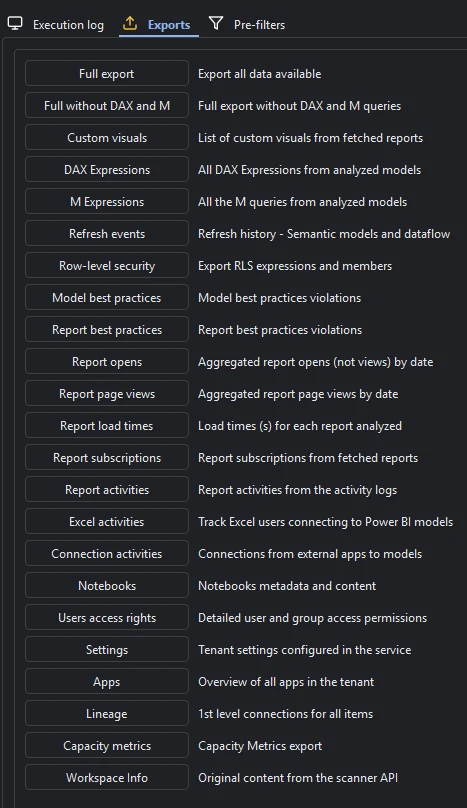
| Export | What’s in it |
|---|---|
| Full export | Every dataset listed below, in one bundle |
| Full without DAX and M | The bundle minus the DAX and M expression dumps (smaller file) |
| Custom visuals | Custom visuals from fetched reports |
| DAX Expressions | All DAX from analyzed models |
| M Expressions | All M queries from analyzed models |
| Refresh events | Refresh history for semantic models and dataflows |
| Row-level security | RLS expressions and member assignments |
| Model best practices | Best-practice violations on models |
| Report best practices | Best-practice violations on reports |
| Report opens | Aggregated report opens (not views) by date |
| Report page views | Aggregated page views by date |
| Report load times | Load times (seconds) for each report analyzed |
| Report subscriptions | Report subscriptions from fetched reports |
| Report activities | Report activities from the activity logs — report opens, data exports (ExportReport), and more |
| Excel activities | Excel users connecting to Power BI models |
| Connection activities | Connections from external apps to models |
| Notebooks | Notebooks metadata and content |
| Users access rights | Detailed user / group access permissions |
| Settings | Tenant settings configured in the service |
| Apps | All apps in the tenant |
| Lineage | First-level connections for all items |
| Workspace Info | Original content from the Scanner API |
| Capacity metrics | CU consumption, per-item cost breakdown, and historical capacity usage |
Related
- Run a tenant-wide scan — the walkthrough that produces this UI
- Run your first online scan — the single-model online walkthrough that uses many of these same tabs