Find broken visuals in Power BI reports
See how many visuals are broken in every Power BI report in your tenant — then drill into which visuals, on which pages, and the exact reason each one broke.
Last updated · June 12, 2026
Availability: Broken-visual detection — Measure Killer v2.9.5 and later.
What you get
Every report in the Power BI reports tab gets a Broken visuals column — how many visuals in that report are currently broken. The count rolls up through the tree: expand a report to see which pages (including hidden pages) carry broken visuals, and expand a page to see the count per individual visual.
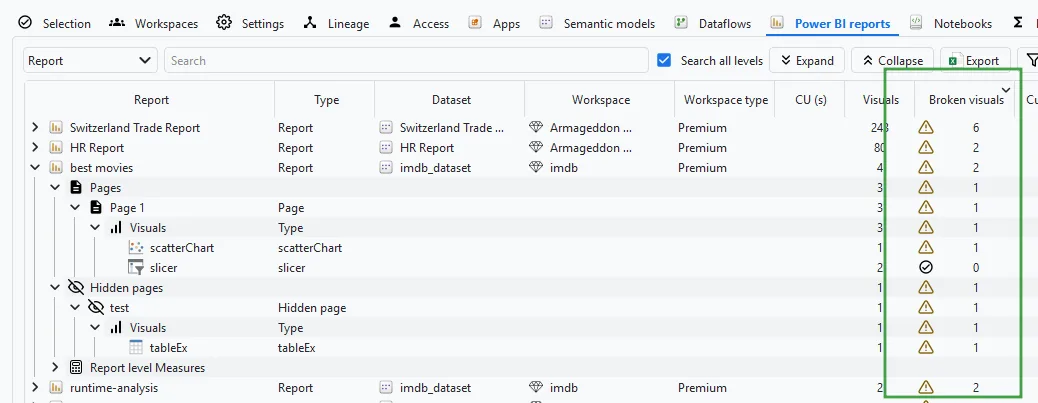
Instead of waiting for a report consumer to stumble over an error message, you see immediately — tenant-wide — where a problem might be.
Why visuals break
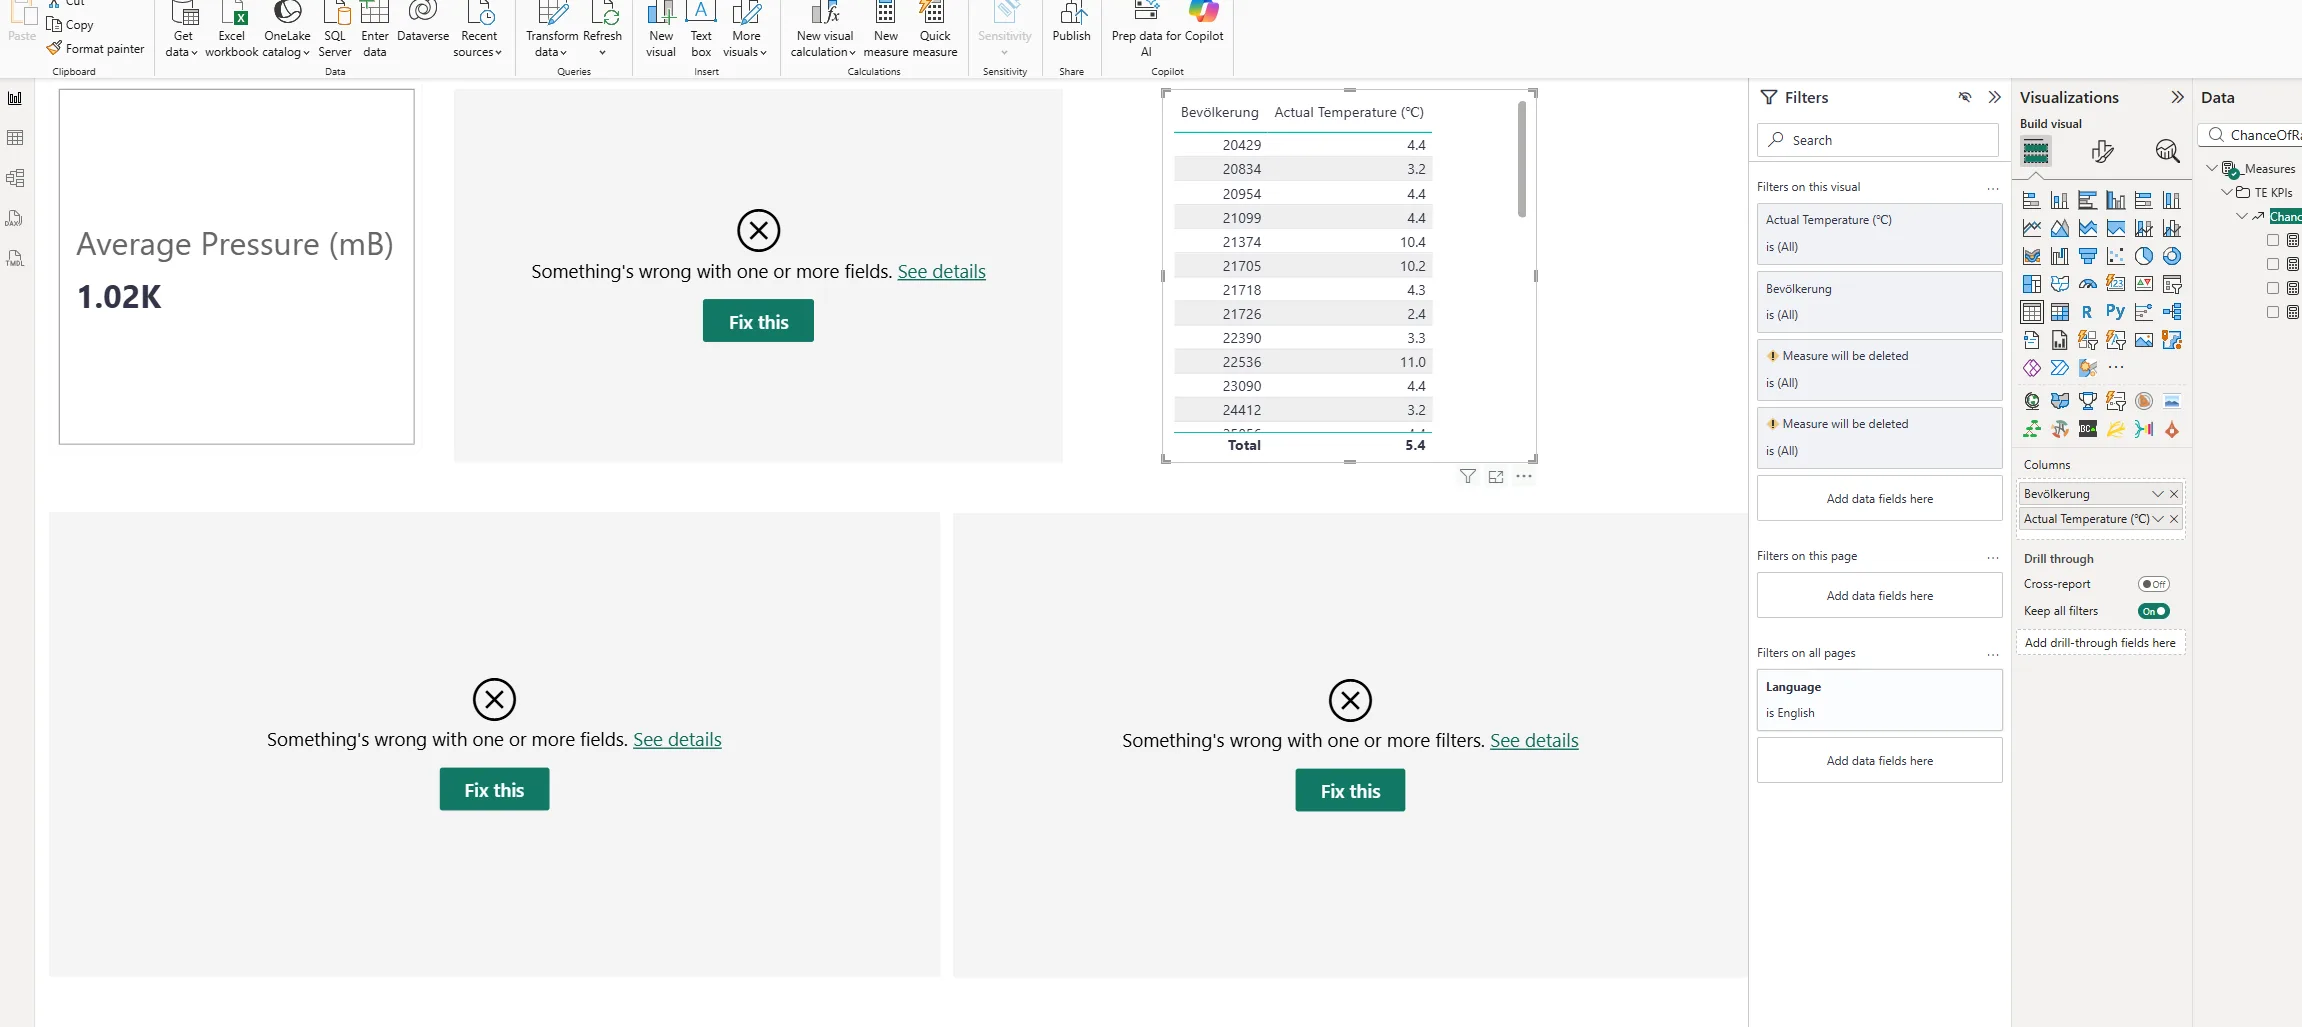
A broken visual is one that renders an error instead of data — the “Something’s wrong with one or more fields” (or filters) message Power BI shows its viewers:
Typical causes:
- A column or measure the visual uses was renamed or removed from the semantic model.
- A measure the visual references contains broken DAX — the expression no longer evaluates.
- A visual-level filter references an artifact that no longer exists or no longer works.
These often go unnoticed: the report still opens, the rest of the page still renders, and nobody tells the report owner.
Run the analysis
-
Run a tenant-wide scan and complete Phase 2 by selecting items and clicking Analyze.
-
Run Phase 3 — the Broken visuals column only populates after the analysis pass runs, not straight after Phase 2.
-
Switch to the Power BI reports tab.
-
Sort the Broken visuals column (descending) to surface the reports with the most breakage.
-
Right-click a report or a page and choose View broken visuals:
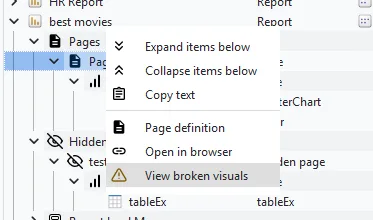
-
The detail window lists every broken visual with the reason it broke:
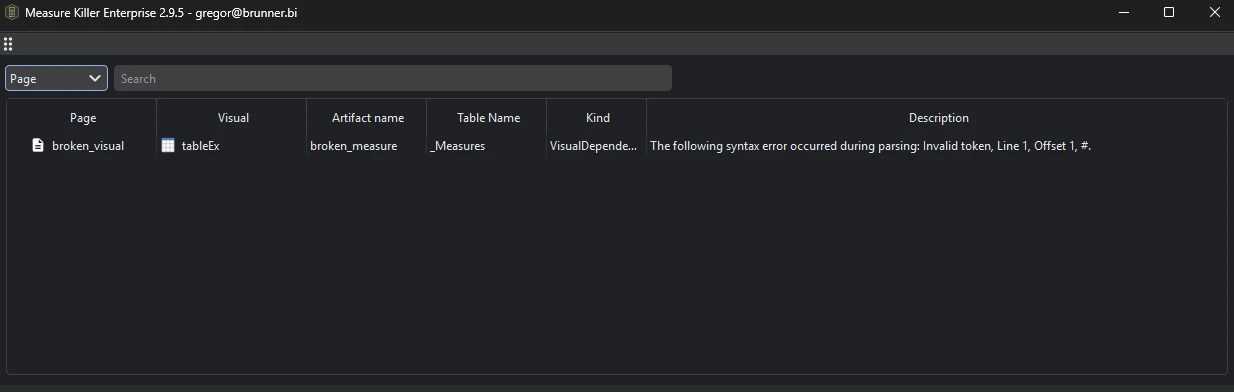
What the detail list shows
- Visual — the visual type (pivot table, clustered column chart, line chart, …).
- Artifact name and Table name — the column or measure the visual depends on.
- Kind — how the broken artifact is used: VisualDependency (a field bound to the visual itself) or VisualLevelFilterDependency (a visual-level filter).
- Reason — the exact error, e.g. “Artifact Column 3 in table 01_Customers_Clean not found in the model” or the failing DAX expression with its syntax error.
Common workflows
- Fix high-traffic reports first. Combine the Broken visuals column with views and page views: a broken visual on a page nobody opens can wait — one on a page with hundreds of monthly views is an incident. Sort by views, then scan the Broken visuals column.
- Verify nothing broke after a model change. After a schema change, a model cleanup, or a migration, re-run the scan and check the Broken visuals column — it’s the fastest tenant-wide answer to “did we break any reports?”
- Trace breakage back to broken DAX. If the reason is a failing expression, Find broken DAX lists every failing measure and calculated column per model, and the DAX expressions tab lets you locate and inspect the offending expression.
- Audit hidden pages too. Broken visuals on hidden pages are detected as well — useful because hidden pages are exactly where breakage survives longest unnoticed.
What to do with the findings
- Fix the visual or the model — re-bind the visual to an existing field in Power BI Desktop or the Service, restore the removed artifact, or repair the broken DAX.
- Notify the owner — the reports tab shows the owner / last modified by, so you know who to hand each finding to.
- Export to Excel / JSON — paid editions can export the report inventory including the broken-visuals counts for remediation tracking.
Related
- Power BI reports inventory — the tab where the Broken visuals column lives
- Report views & opens — prioritize fixes by page-level traffic
- Find broken DAX — the model-side companion: failing measures, calculated columns, and calculated tables
- Semantic models inventory — the # of DAX errors column, per model
- DAX expressions — find and inspect the broken expressions behind the visuals
- Find visual types — locate every visual of a given type tenant-wide
- Run a tenant-wide scan — the scan that populates the column