Report load times — find slow Power BI reports
Average render time per user for every Power BI report in the tenant — spot reports slow to open, track performance over time, and prioritize by usage.
Last updated · June 26, 2026
What you get
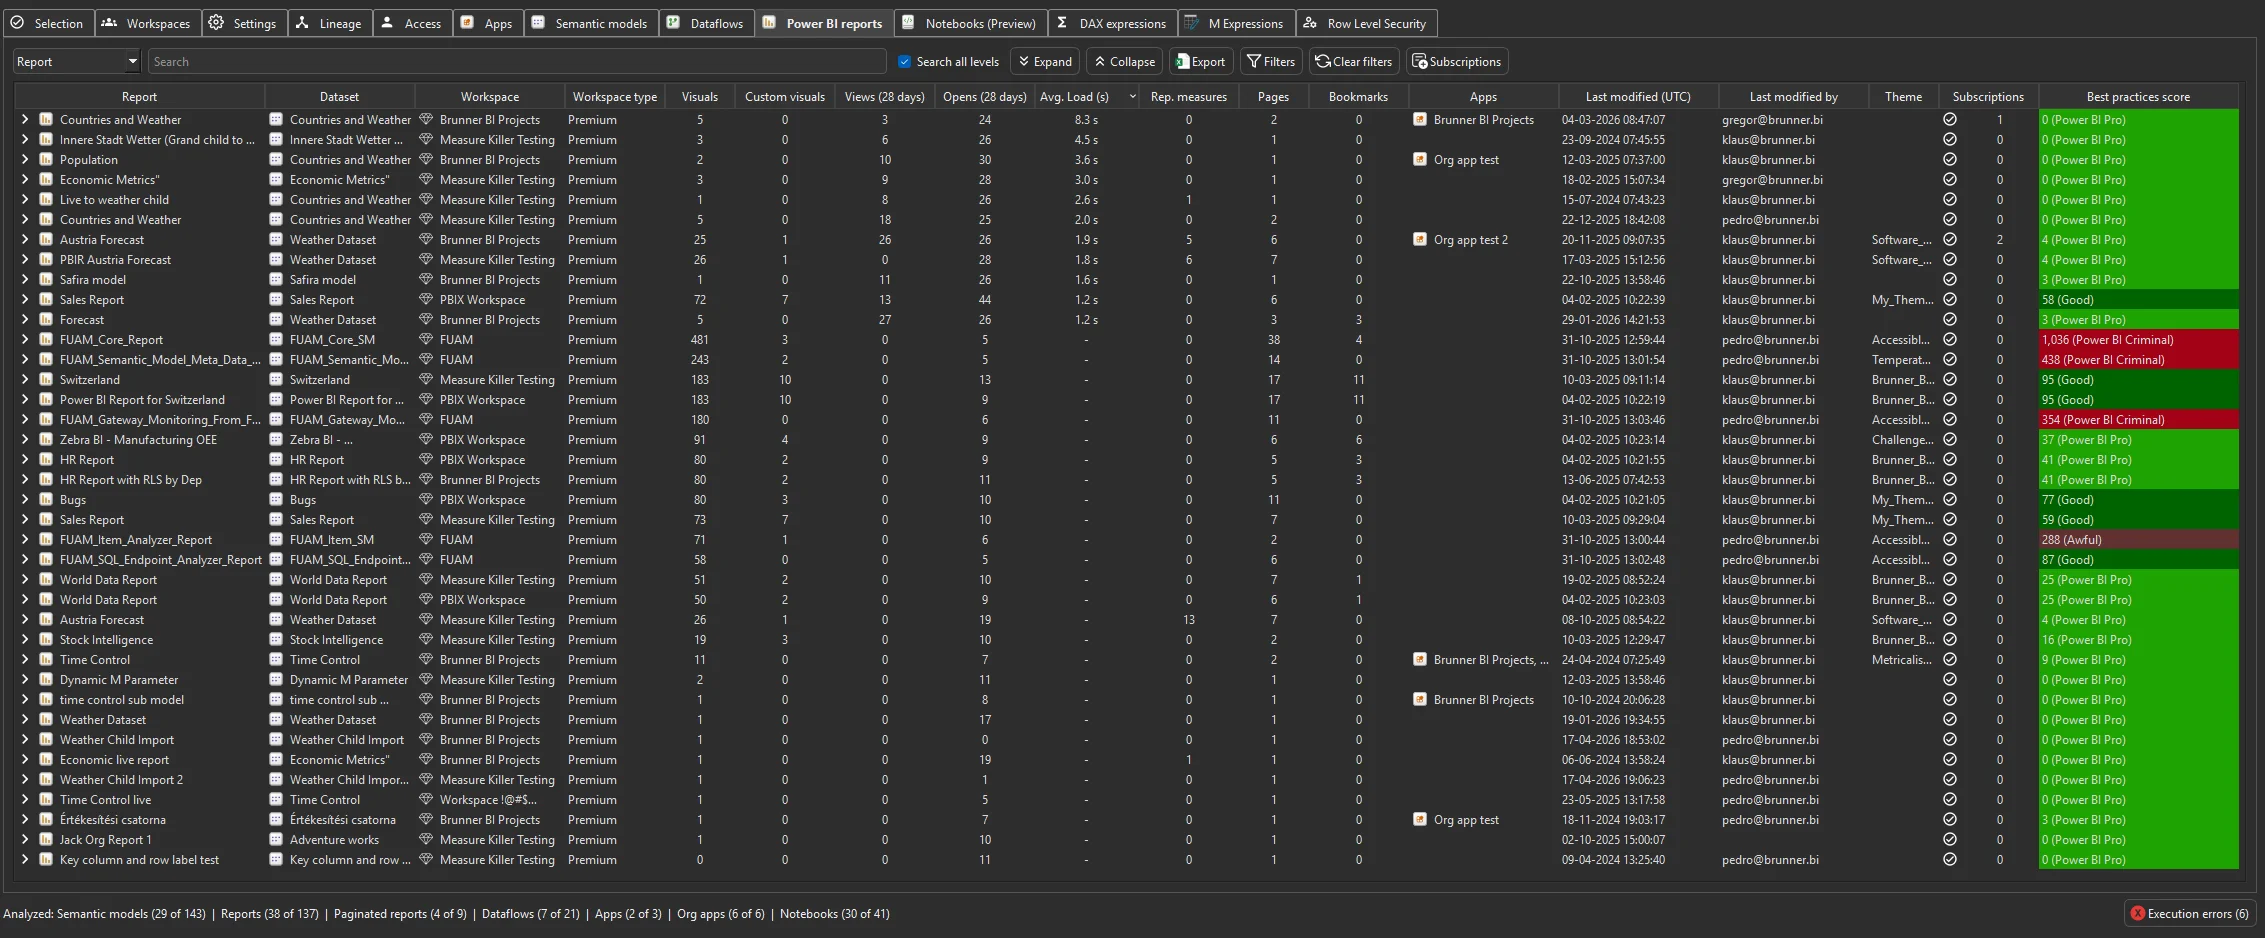
The Average load time column on the Power BI reports tab shows how long each report takes to fully render, averaged per user, in seconds. This is one of the most direct performance metrics available for Power BI reports — it measures real end-user experience, not synthetic benchmarks.
Reports that consistently take more than 5–10 seconds to open are worth investigating. Common causes include too many visuals per page, heavy DAX calculations, a poorly optimized underlying semantic model, or slow data sources in DirectQuery mode.
Like opens and page views, load times are stored in a local
SQLite database in %APPDATA%. Each scan merges fresh data with
what’s already stored, so your performance history accumulates
beyond the 28-day window — you can track whether a report is
getting slower or faster over time.
Load times work for any user with Contributor access to the workspaces in scope — including Limited Tenant Analysis mode. No Fabric Admin role needed.
Run the analysis
- Run a tenant-wide scan — when configuring the pre-filters, make sure the page views toggle under Performance is enabled (this also enables load-time collection).
- Complete Phase 2 by selecting items and clicking Analyze.
- Switch to the Power BI reports tab and sort by Average load time (descending) to surface the slowest reports first.
How to read the results
The load time is an average per user — it reflects how long real users wait for the report to fully render in their browser. A few benchmarks:
- Under 3 seconds — good. Users perceive the report as fast.
- 3–5 seconds — acceptable for complex reports, but worth reviewing if usage is high.
- 5–10 seconds — slow. Users notice the delay. Investigate the report design and underlying model.
- Over 10 seconds — problematic. Users are likely to abandon the report or complain. Prioritize optimization.
Common workflows
- Surface the worst offenders. Sort by Average load time (descending) to find the slowest reports in the tenant. Focus on the reports above 5–10 seconds — these are the ones users feel.
- Prioritize by impact. Cross-reference load times with report views & opens. A slow report with hundreds of weekly views affects far more users than a slow report nobody opens. Fix the high-traffic slow reports first.
- Track performance over time. Because load times accumulate in the local SQLite database across scans, you can compare a report’s load time this month vs. last quarter. Use this to catch regressions — a report that went from 2 seconds to 8 seconds probably had a model or visual change that needs attention.
- Diagnose root causes. Once you’ve identified a slow report, work through two layers. First, check report best practices — too many visuals per page, heavy report-level measures, or misconfigured interactions can all inflate render time. Then drill into the connected semantic model: the used/unused analysis reveals bloat (unused columns, oversized tables) that inflates the model, and model best practices flag anti-patterns like missing aggregations or deeply nested DAX. Also check the model’s storage mode in the semantic models inventory — DirectQuery and Dual models depend on source-system performance at query time, while Import models may be slow because the model itself is too large.
- Before-and-after validation. After optimizing a report or its model, run another scan and compare load times. The SQLite history gives you a baseline to measure the improvement against.
Export the data
The consumption data is visible as raw data in the app — you can browse the underlying numbers directly and export to Excel from the toolbar.
For programmatic use, the Exports sidebar includes a dedicated Report load times JSON export with load times (in seconds) for every report analyzed.
With MK Automation, load-time data lands in Fabric Lakehouse or Warehouse tables on a schedule — feed it into Databricks, Snowflake, or a Power BI report to track performance trends across the tenant without manual scans.
Related
- Report views & opens — page-level consumption data (opens and page views) with long-term retention beyond 28 days
- Power BI reports inventory — the tab where load times appear alongside views, custom visuals, and subscriptions
- Best-practice analysis — report and model rule violations that often correlate with slow load times
- Semantic models inventory — storage mode, size, refresh history — context for understanding why a model is slow
- Find and remove unused measures and columns — reduce model bloat to improve render performance
- MK Automation — scheduled scans with results written to Fabric tables or your data warehouse