Run a tenant-wide scan in Power BI and Fabric
Scan every workspace, semantic model, report, and dataflow in your Power BI / Fabric tenant — the foundation every Measure Killer Enterprise feature builds on.
Last updated · June 24, 2026
What you get
Tenant Analysis is Measure Killer’s broadest scan — it walks every workspace your account can reach, builds a tenant-wide inventory, and then lets you drill into individual models, reports and dataflows for their full metadata. The scan runs in three phases and unlocks the full Tenant Analysis UI:
Inventory & governance (Phase 1)
- Tenant summary — every workspace, item and user across Power BI and Fabric
- End-to-end data lineage in Power BI — trace every dependency from data source to report, across workspaces
- Access & permissions — workspace and per-item access, with AD / Entra groups expanded (Tenant Analysis only)
- Apps & audiences — all Apps (including org Apps) with audiences, 28-day consumption and contacts
- Tenant settings — every Power BI / Fabric admin setting in the tenant
Per-item metadata (Phase 2)
- Semantic models — refresh history, schedule, average duration, storage mode, best-practice rules and KPIs for every model
- Dataflows (Gen1 + Gen2) — inventory every Dataflow with its M code, refresh stats and number of queries
- Power BI reports — opens, page views, average load time, certified vs custom visuals, report-level measures and report subscriptions. See Report views & opens for the page-level consumption detail and long-term retention
- Fabric Notebooks — locations, access and lines of code per notebook
- DAX expressions — searchable index of every DAX measure across scanned models
- M expressions — searchable index of every Power Query / M query across scanned models and dataflows
- Row Level Security — every RLS role and assignment across scanned models
- Custom visual consumption — which custom visuals are used, where, certification status, and license compliance
- Capacity metrics — CU consumption, per-item cost breakdown, and historical capacity usage across your Fabric / Premium capacities (new in v2.9.5)
- Find broken DAX — a # of DAX errors count per model: failing measures, calculated columns and calculated tables, with the exact error (new in v2.9.5)
- Report data exports — the ExportReport activity from the activity logs: who exported a visual’s underlying data, and from which report (new in v2.9.5)
Activity logs, report opens/page views/load times, and capacity metrics
are stored in a local SQLite database in %APPDATA%. Each scan
merges fresh API results with what’s already there, so your history
accumulates beyond the window each API retains (28 days for activity
data, 14 for capacity metrics) — no extra setup required.
Analysis & insights (Phase 3)
- Analyze model usage — used/unused analysis across every scanned model, with % unused and estimated freeable size
- Model similarity — pairwise similarity score for every scanned semantic model to find duplicates
- Report similarity — pairwise similarity score for every scanned report to find near-duplicates
- Find broken visuals — how many visuals render an error instead of data per report, drillable per page and per visual with the reason (new in v2.9.5)
- Clean your model — step-by-step cleanup suggestions with estimated size reductions
- Export to JSON — every slice of the scan as raw JSON files for AI, governance dashboards or downstream tools (including capacity metrics)
Which mode you run depends on your tenant role — see Pick the mode below. For a glossary of every tab, panel and toolbar action visible above, see the Tenant Analysis UI reference.
Pick the mode — Tenant Analysis vs Limited Tenant Analysis
Two welcome-screen tiles run the same engine but with different scope. Which one you pick depends on your permissions and how much of the tenant you need to see.
Pick the path that matches your permissions — they’re independent, so you only need to read your own. Both sign in to Microsoft, then run the same three-phase scan.
Tenant Analysis
Who it’s for: Fabric Administrators and Power Platform Administrators who need full visibility across the entire tenant.
What you get:
- Every workspace in the tenant, including ones you aren’t a member of and personal workspaces (“My workspace”)
- The Access tab — every principal with their role on every workspace and item
- Refresh schedules for dataflows and report subscriptions
- Full workspace domain information
How to start:
-
Open Measure Killer and click the Tenant Analysis tile in the Admins group on the welcome screen.
-
Measure Killer opens your default browser with a Microsoft sign-in page. Log in with an account that has the Fabric Administrator or Power Platform Administrator role. Measure Killer keeps the access token Microsoft returns and uses it for every Power BI / Fabric API call. Your password never goes through Measure Killer.
-
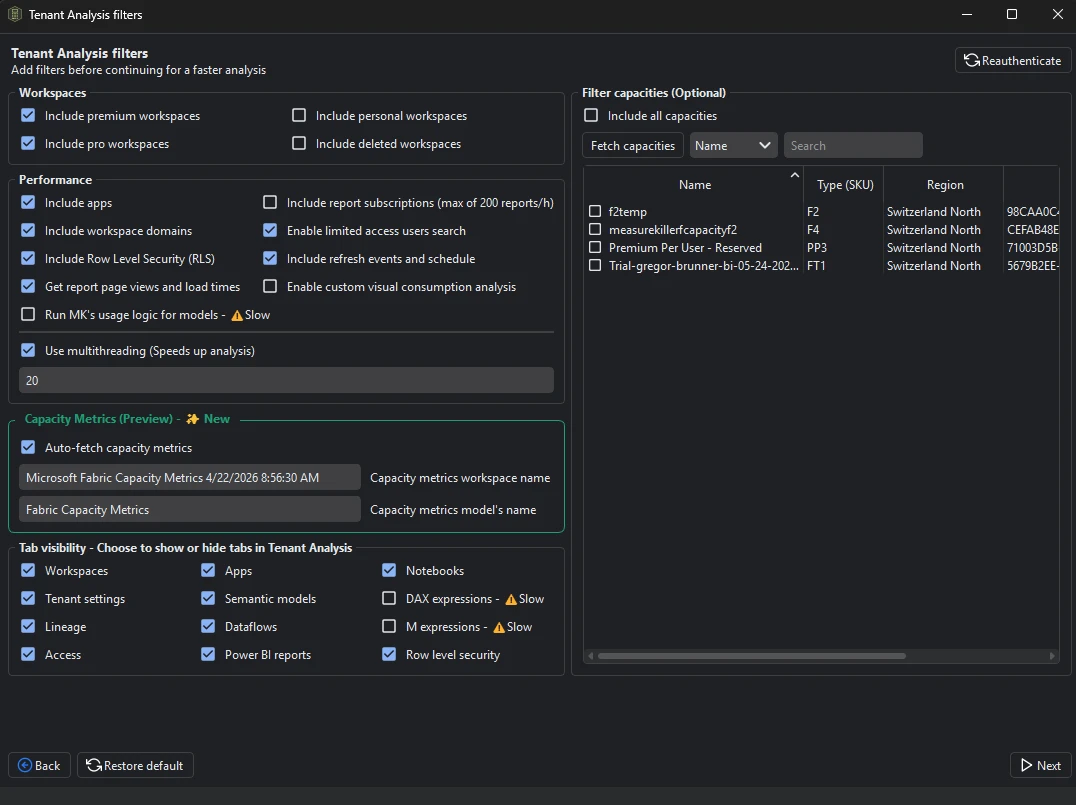
The Tenant Analysis filters window opens. Configure the scope:
- Workspaces — toggles for Premium, Pro, personal (“My workspace”), and deleted workspaces.
- Performance — per-feature toggles for apps, report subscriptions, workspace domains, Row Level Security, refresh events, page views, custom visual consumption. Use multithreading speeds up the scan. Untick anything you don’t need — each toggle adds time.
- Measure Killer Analysis → Pre-run MK’s used/unused logic for models — off by default (⚠️ Slow). Ticking it runs Phase 3 automatically so the % unused figures are populated in one pass.
- DAX expressions and M expressions — retrieving the full DAX / M code for the expression search tabs is now flagged ⚠️ Slow; leave off unless you need to search across all expressions.
- Tab visibility — show or hide individual tabs to keep the UI focused.
- Filter capacities (Optional) — click Fetch capacities to scope the scan to specific Premium / PPU / Fabric capacities. Full Tenant Analysis only — capacity filtering is not available in Limited Tenant Analysis.
- Capacity Metrics (Preview) (new in v2.9.5) — tick Auto-fetch capacity metrics to pull Capacity Unit (CU) consumption as part of the scan, so the CUs columns populate automatically. See Capacity metrics.
-
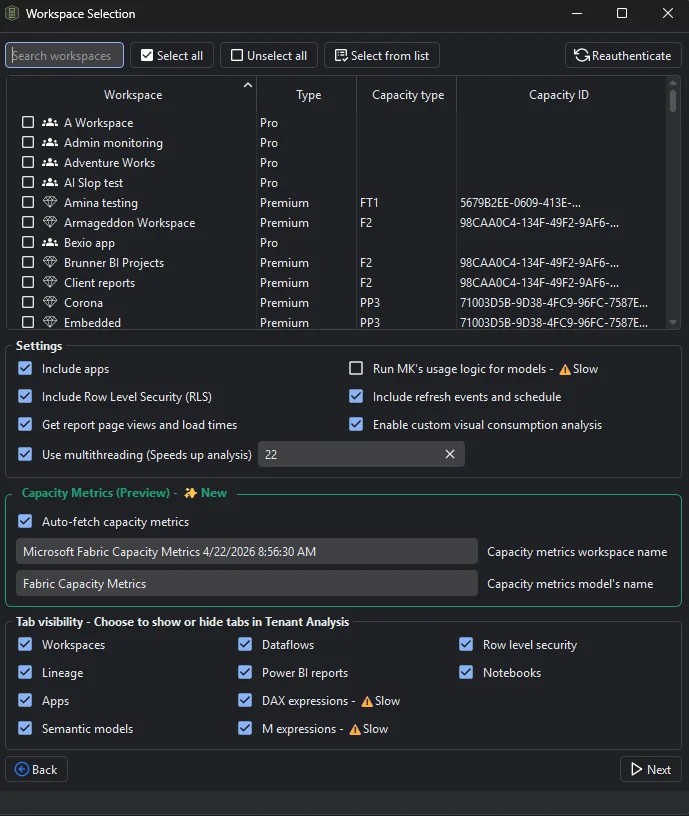
Click Next and pick which workspaces (or individual items) to scan. Tick whole workspaces to pull everything inside them, or expand a workspace and tick specific semantic models, reports, dataflows or notebooks.
-
Click Start — Phase 1 runs automatically.
Service principals are not supported — Tenant Analysis runs with delegated user auth only. If you need unattended / scheduled runs, point a dedicated service user (a real Microsoft account with the Fabric Admin role) at the scan, not a service principal.
Limited Tenant Analysis
Who it’s for: Developers, analysts, and team leads who don’t have tenant-wide admin permissions but need to scan the workspaces they have access to.
What you get:
- The workspace picker only shows workspaces your account has access to — you select which ones to scan from that list
- Contributor (or higher) access is safest; Viewer is enough for Power BI report metadata only
- The same deep-scan tabs as Tenant Analysis (Semantic models, Reports, Dataflows, DAX expressions, M expressions, RLS)
What you don’t get (compared to full Tenant Analysis):
- Workspaces you don’t have access to won’t appear in the picker at all
- No personal workspaces (“My workspace”) of other users
- No Access tab
- No refresh schedule for dataflows or report subscriptions
- No capacity filtering
- No limited-access user search
How to start:
-
Open Measure Killer and click the Limited Tenant Analysis tile in the Developers group on the welcome screen.
-
Measure Killer opens your default browser with a Microsoft sign-in page. Log in with your Microsoft account. Measure Killer keeps the access token Microsoft returns and uses it for every Power BI / Fabric API call. Your password never goes through Measure Killer.
-
The Tenant Analysis filters window opens. Configure the scope (some options from full Tenant Analysis are not available here):
- Workspaces — toggles for Premium, Pro, and deleted workspaces. Personal workspaces, capacity filtering, and limited-access user search are not available in Limited mode.
- Performance — per-feature toggles for apps, workspace domains, Row Level Security, page views, custom visual consumption. Use multithreading speeds up the scan. Untick anything you don’t need — each toggle adds time.
- Measure Killer Analysis → Pre-run MK’s used/unused logic for models — off by default (⚠️ Slow). Ticking it runs Phase 3 automatically so the % unused figures are populated in one pass.
- DAX expressions and M expressions — retrieving the full DAX / M code for the expression search tabs is now flagged ⚠️ Slow; leave off unless you need to search across all expressions.
- Tab visibility — show or hide individual tabs to keep the UI focused.
- Capacity Metrics (Preview) (new in v2.9.5) — tick Auto-fetch capacity metrics to pull Capacity Unit (CU) consumption during the scan. Available in Limited mode too (you need Capacity Admin on the capacity). See Capacity metrics.
-
Click Next and pick which workspaces (or individual items) to scan from the workspaces available to your account. Tick whole workspaces or expand and tick specific items.
-
Click Start — Phase 1 runs automatically.
If you don’t know which you need, start with Limited Tenant Analysis — it works with the permissions you already have and only shows workspaces you can access. If you later need tenant-wide visibility or the Access tab, escalate to full Tenant Analysis with a Fabric Admin account.
Run the scan — three phases
Tenant Analysis runs in three phases, with an optional fourth. Knowing the difference matters because most of the right-side tabs are greyed out until you trigger Phase 2, and the deeper analysis features (used/unused, similarity) only become available after Phase 2 completes.
Phase 1 — Inventory pass (automatic)
Once you confirm the workspace selection, Measure Killer runs the inventory pass on its own — you don’t click anything. It walks every workspace in scope and pulls the workspace-level inventory: workspaces, settings, domains, apps, and end-to-end lineage (from data source to report, item-level — not column-level). This populates the always-on tabs:
- Workspaces — every workspace with type, capacity, owners
- Settings — tenant-level Power BI / Fabric settings
- Apps — every Power BI app and audience
- Lineage — end-to-end lineage from data sources through semantic models, dataflows and reports across the tenant (item-level)
- Access — Tenant Analysis only (not Limited TA); principals + roles per workspace and item
At this point the Tenant summary panel is also populated with aggregate counts of every Power BI and Fabric item type — see Tenant summary.
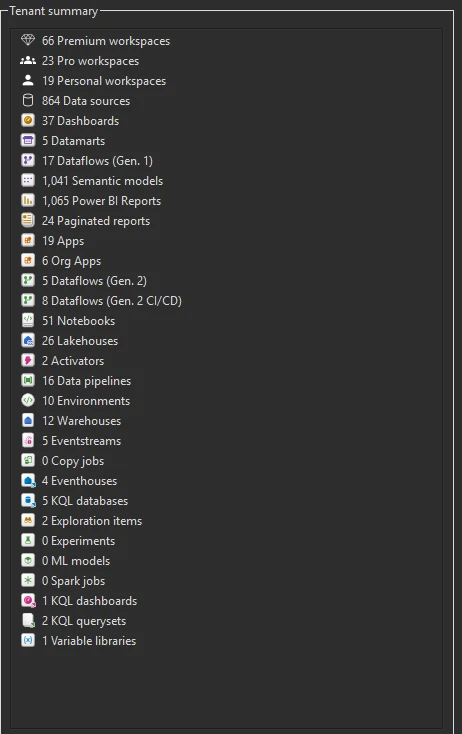
Tenant summary after Phase 1.
The deeper-analysis tabs — Semantic models, Dataflows, Power BI reports, Notebooks, DAX expressions, M Expressions, Row Level Security — are greyed out at this stage. You don’t have their data yet because Phase 1 doesn’t read into the items themselves.
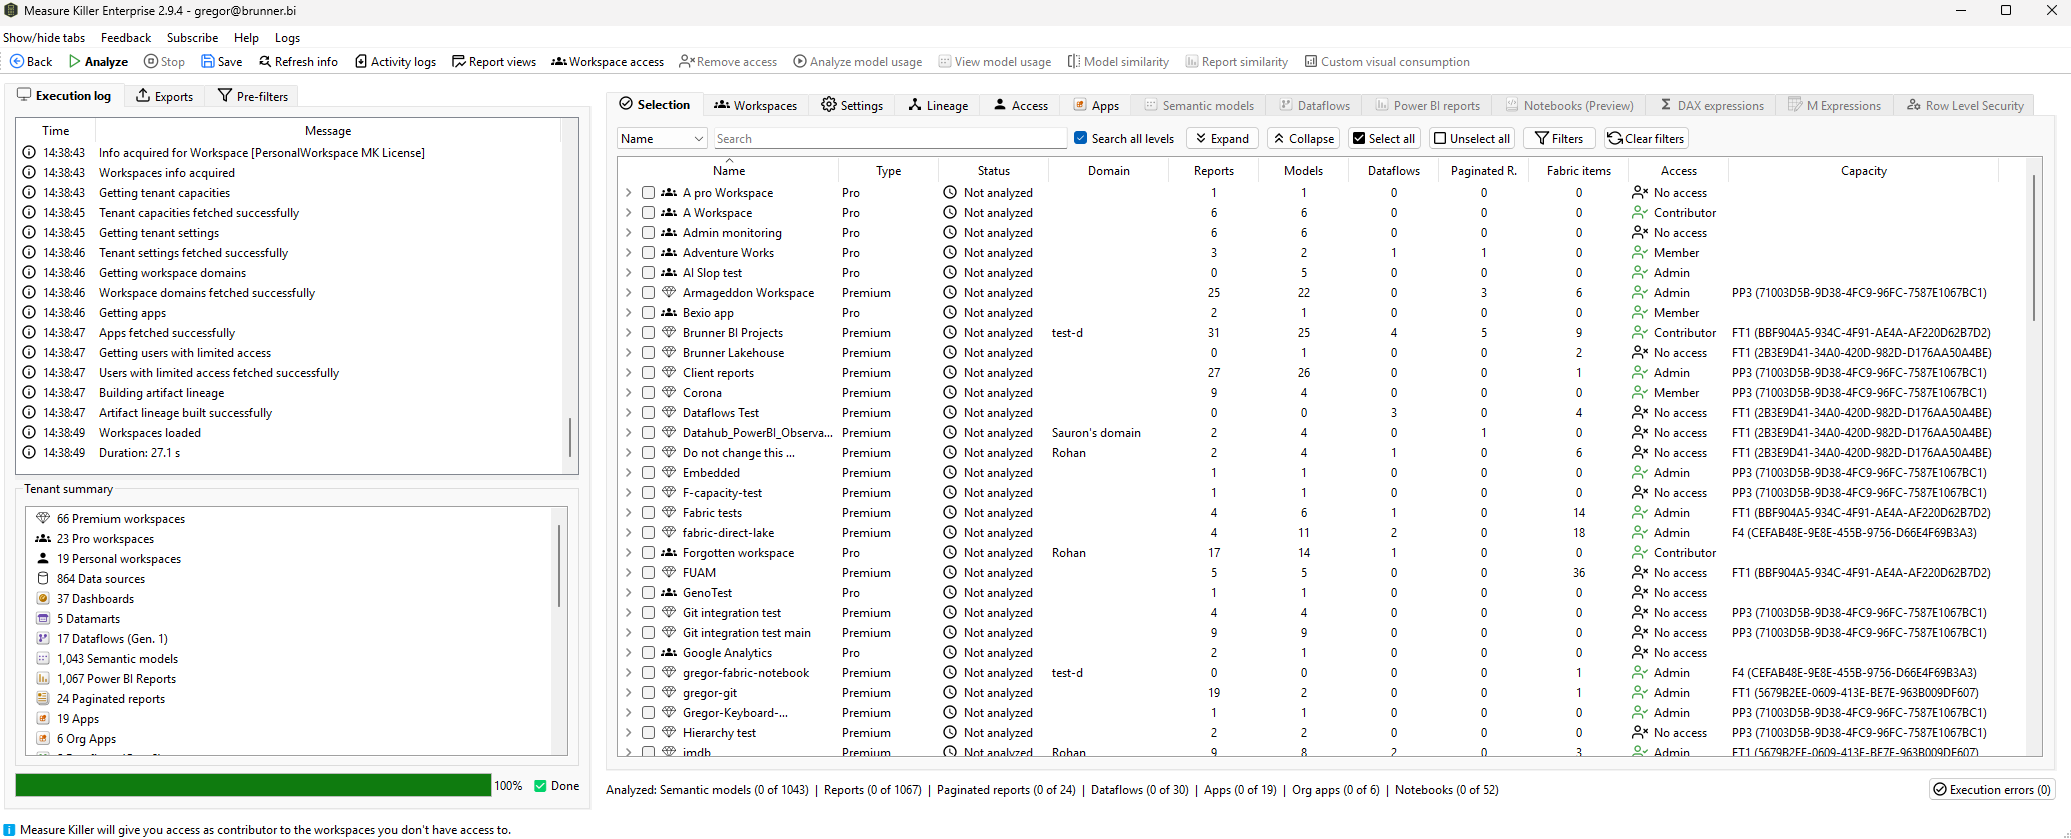
Phase 1 complete — inventory tabs populated, deeper tabs greyed out.
Phase 2 — Metadata retrieval (click Analyze)
To activate the greyed-out tabs, tick the individual items you want the full metadata for — semantic models, reports, dataflows, notebooks, and apps — and click Analyze. Measure Killer reads each selected item’s deep metadata (model schema, DAX expressions, M queries, report visuals, RLS roles, notebook content, app audiences and contents) and unlocks the corresponding tabs.
Ticking a semantic model is a shortcut for “model + everything downstream”. When you select a semantic model for Phase 2, Measure Killer automatically pulls in every report connected to that model and every downstream semantic model (composite / chained) plus the reports on those downstream models — along with those reports’ opens, page views, and average load times and the model’s capacity (CU) consumption. You don’t need to tick the consumers manually — selecting the model is enough to capture the full impact tree, its consumption, and its cost. This applies in both Tenant Analysis and Limited Tenant Analysis.
You can iterate: let Phase 1 finish, decide which items deserve a closer look from the workspace-level data, then deep-scan only those. This keeps long-running scans focused and avoids fetching metadata for items you don’t care about.
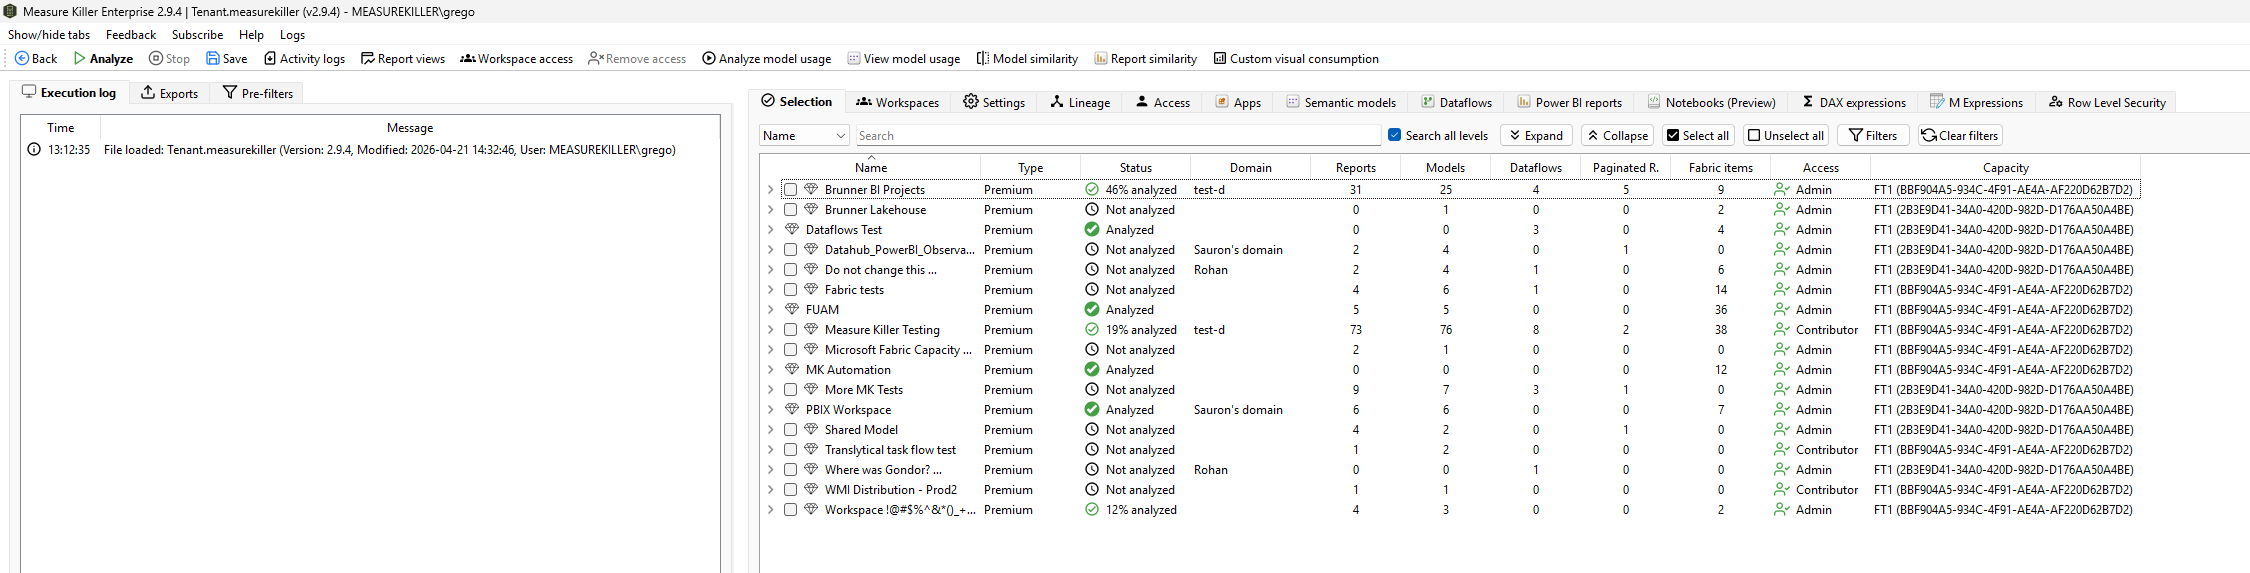
Phase 2 complete — Selection tab showing analysis status per workspace, all deep tabs now activated.
Phase 3 — Analysis (model usage or similarity)
After Phase 2 has pulled the metadata, you can run one of the deeper analysis passes. These run locally on the data already fetched, with no extra API calls.
Option A — Analyze model usage (find unused at tenant scale)
The toolbar’s Analyze model usage action runs the core Measure Killer used/unused analysis across every scanned semantic model in the tenant.
The output is the tenant-scale version of the Clean your model tab from the single-model scan: every semantic model gets a % unused figure and an estimated size that can be freed in the Semantic models tab, sortable by either column. That makes it trivial to surface the biggest cleanup wins across the tenant — “this 4 GB shared model is 62% unused” is the row you want at the top.
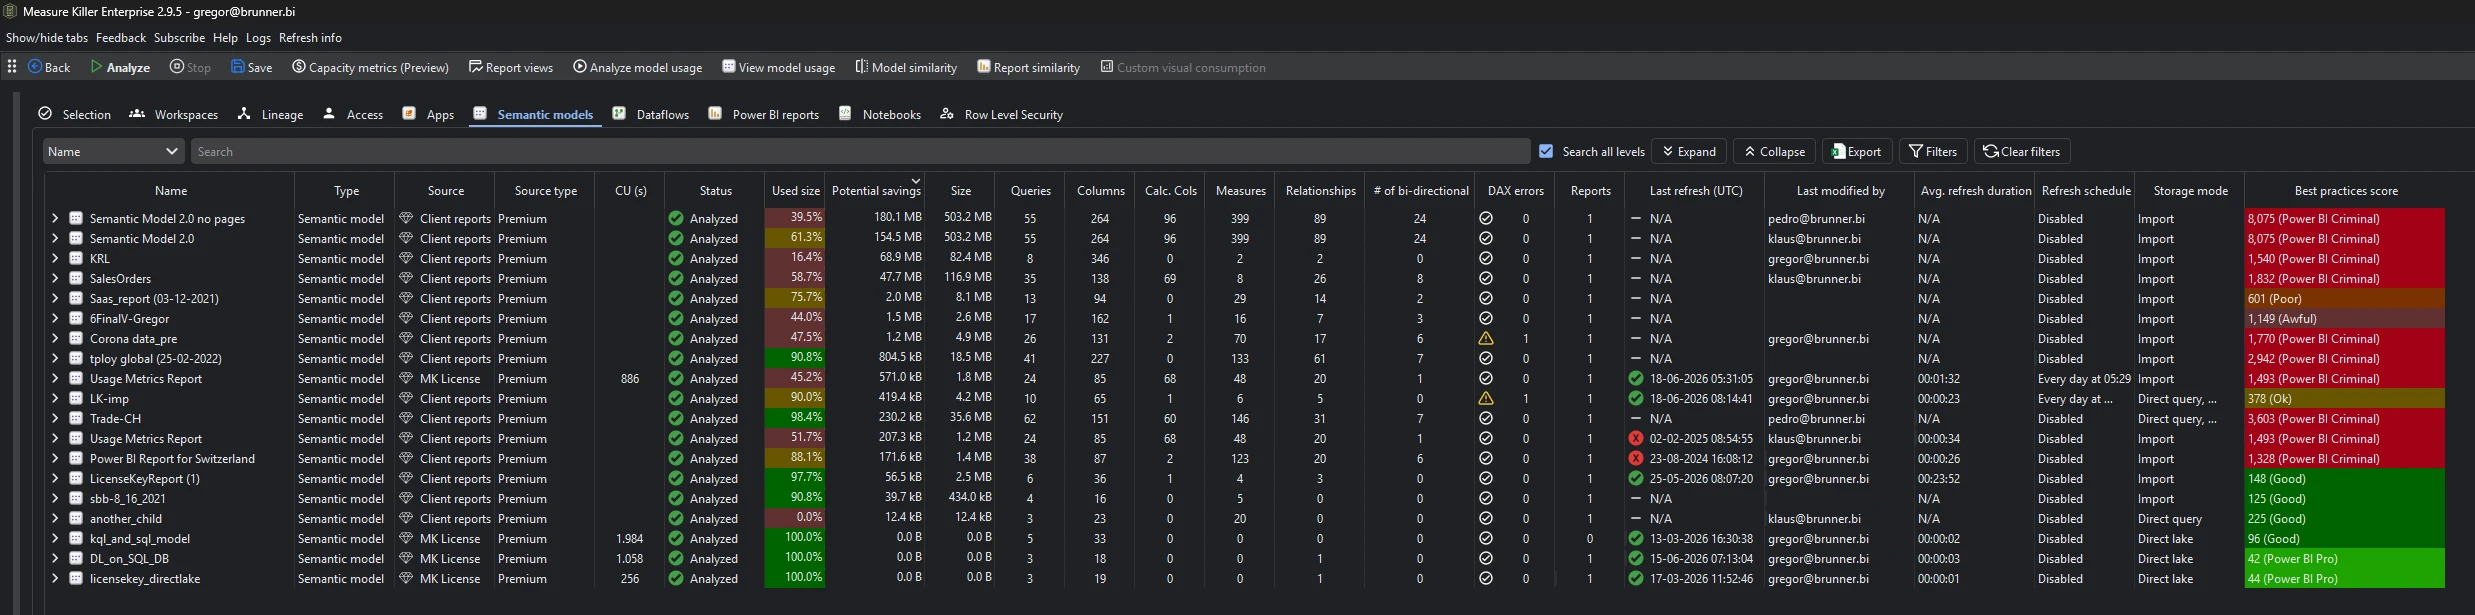
Semantic models tab after Analyze model usage — Used size, Potential savings, and Best practices score per model.
View model usage is the per-model drill-down. Select any one semantic model and click View model usage to see every column, measure, table and relationship with the visuals, reports, Excel files and downstream models that reference each one.
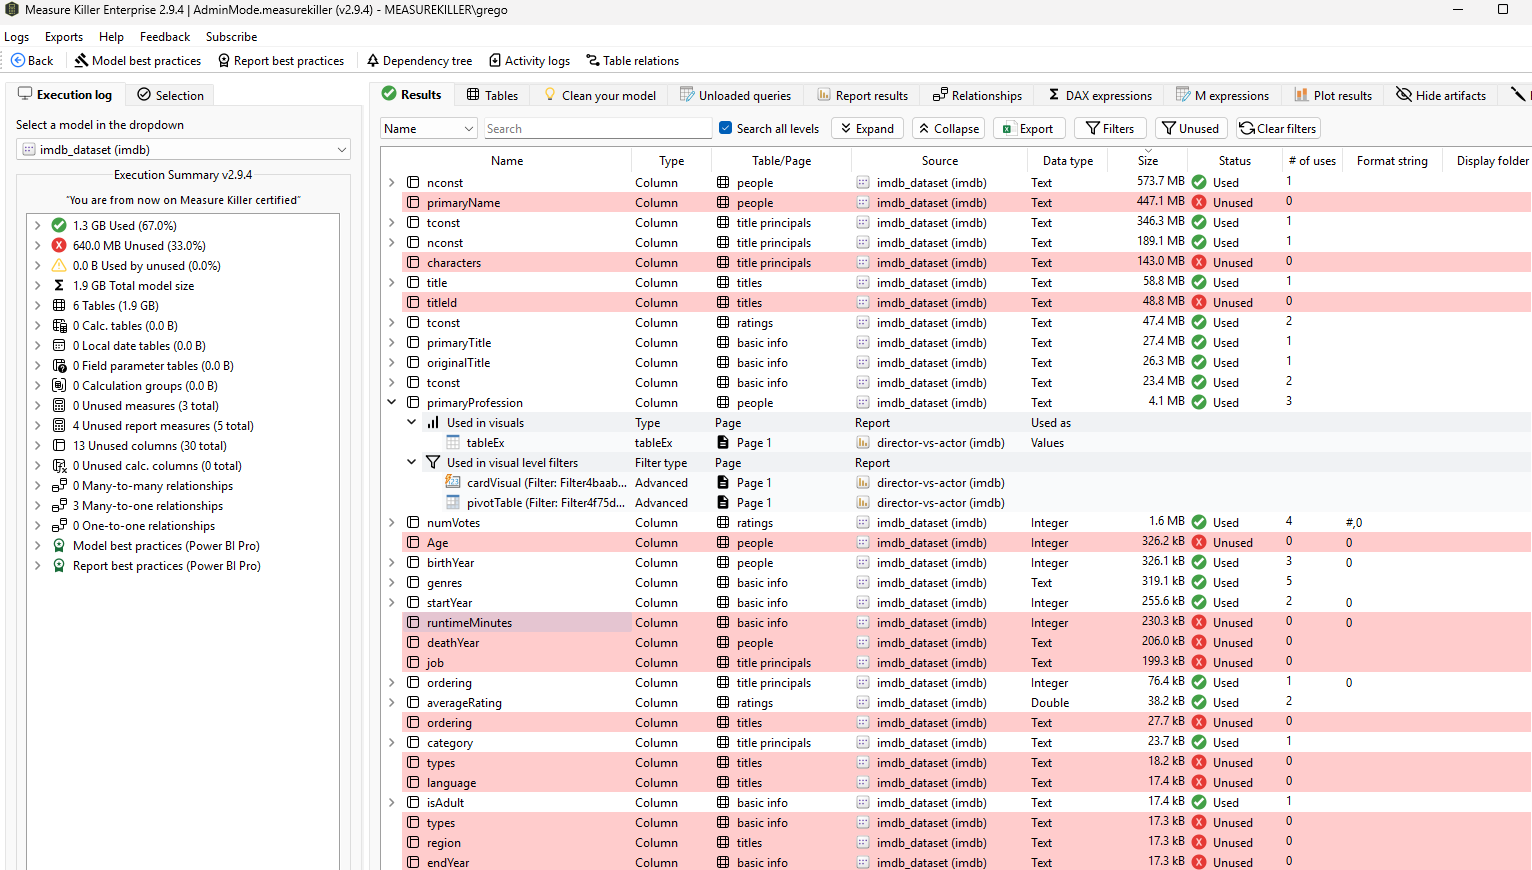
View model usage drill-down — used/unused status and where-used details for every column and measure.
Option B — Model similarity or Report similarity
Instead of (or in addition to) analyzing usage, you can run Model similarity or Report similarity from the toolbar. These compare every scanned model or report pairwise and assign a similarity score to each pair — the fastest way to find duplicates and near-duplicates worth consolidating.
For full walkthroughs, see:
How long does it take
The two phases scale very differently.
Phase 1 (inventory) is fast — a few seconds to a few minutes, roughly regardless of tenant size. The workspace-level metadata is cheap to fetch; you’ll be looking at populated Workspaces / Settings / Apps / Lineage / Access tabs within minutes even on a large tenant.
Phase 2 (per-item drill-down) is where the time goes. Pulling the deep metadata for every selected model, report and dataflow follows the same metadata-not-data rule as the single-model scan: model schemas, DAX, M queries, report visuals, RLS roles. A model with many measures and visuals takes longer than a model with much more underlying data but few calculations and visuals.
- Small tenants (a few dozen workspaces, hundreds of items) — Phase 1 in seconds; Phase 2 in minutes if you deep-scan everything.
- Medium tenants (hundreds of workspaces) — Phase 1 in a couple of minutes; Phase 2 in tens of minutes to an hour depending on how much you tick.
- Large tenants (thousands of items) — Phase 1 still finishes in minutes. A full-tenant Phase 2 can take hours, sometimes overnight. For tenants this size, see Resume an interrupted scan below.
See How long it takes for the per-item benchmarks.
Resume an interrupted scan
You don’t have to deep-scan a thousand-item tenant in one sitting.
The toolbar Save action writes the current state to a
.measurekiller file on disk — every workspace, item, and bit of
metadata Measure Killer has fetched so far, including any Phase 2
work already done. Load that file later and you pick up exactly
where you stopped, with no re-fetch.
A typical large-tenant workflow:
- Let Phase 1 run (it’s fast — minutes at most). You now have the inventory tabs populated.
- Tick a manageable batch of items for Phase 2 and click Analyze. Let it run for as long as you have time — an hour, an afternoon, overnight.
- Click Save when you need to stop; close Measure Killer.
- Next day, open the
.measurekillerfile — every Phase 2 item you already scanned is restored. - Tick the next batch, click Analyze, repeat. Save again at the end of each session.
This also works for handoff — small scans can be saved and shared with a colleague, who opens the file and sees exactly the same data without needing the same admin permissions you ran the scan with.
The Measure Killer process may keep running after you close the window
Heads up: after closing the Measure Killer window — especially after a large scan — the Measure Killer process doesn’t close immediately. It can stay alive in the background for a few minutes (sometimes longer) while it finishes internal cleanup, releases locks, and writes state to disk. The window is gone, but Task Manager will still list a Measure Killer process for a while — this is the most common reason people ask “why is Measure Killer still running after I closed it?”.
This is normal. Two options:
- Let it finish on its own. The process will exit once cleanup is done — usually within a few minutes, occasionally a little more.
- Kill it manually from Task Manager. If you need to free
resources or restart Measure Killer right away, end the process
from Task Manager. Anything already written to a
.measurekillerfile you Saved is safe; only in-memory state that hadn’t been saved is lost.
The bigger the scan, the longer this lingering-process window. On a
thousands-of-items tenant analysis, give it more time than you would
for a single .pbix scan.
Read the results
After Phase 1, the most useful first stops are:
- Tenant summary panel — aggregate counts of every Power BI and Fabric item type, the quickest “what’s in this tenant” answer.
- Workspaces — every workspace with its inventory, owners, capacity and access.
- Apps — every Power BI app + its audiences.
- Lineage — end-to-end lineage from data sources through semantic models, dataflows and reports across the tenant (item-level, not column-level); useful for spotting cross-workspace dependencies.
- Access (Tenant Analysis only) — every principal with their role on every workspace and item.
- Settings — every tenant-level Power BI / Fabric admin setting.
After Phase 2 unlocks the deeper tabs, the natural follow-ons are:
- Semantic models — each scanned model with its detailed metadata, plus a # of DAX errors count and CU consumption (v2.9.5). After running Phase 3, also surfaces a % unused and freeable size per model.
- Dataflows — Gen1 and Gen2 dataflows with M code, refresh stats, downstream models, and CU consumption.
- Power BI reports — views, load times, custom visuals, subscriptions, and — new in v2.9.5 — broken visuals and CU consumption per report.
- Notebooks — Fabric notebooks with run history, lines of code and full-text search.
- DAX expressions and M Expressions — searchable index of every DAX measure and M query in the scanned set.
- Row Level Security — every RLS role and assignment across the scanned models.
New in v2.9.5 — breakage detection & cost
On top of the metadata, v2.9.5 adds two breakage checks and two cost/consumption views to the same scan:
- Find broken DAX — a # of DAX errors column on the Semantic models tab (after Phase 2): every failing measure, calculated column, and calculated table, with the exact error.
- Find broken visuals — a Broken visuals column on the Power BI reports tab (after Phase 3): how many visuals render an error instead of data, drillable per page and per visual with the reason.
- Capacity metrics — Capacity Unit (CU) consumption per capacity, workspace, item, and operation. Also fills the CUs column on the Semantic models, Power BI reports, Dataflows, and Notebooks tabs.
- Report data exports — the ExportReport activity: who exported a visual’s underlying data and from which report — an easily-missed driver of interactive CU spikes.
Common new-user traps
- “The toolbar buttons are greyed out (Analyze model usage, Model similarity, Report similarity, etc.)” This is the most common confusion. These buttons require a selection in the Selection tab — you need to tick at least one semantic model or report before they activate. Go to the Selection tab, tick what you want to work with, then the buttons will become clickable.
- “The Semantic models / DAX expressions tab is empty.” Those tabs only populate after Phase 2. If you just finished Phase 1, you’re looking at the inventory — tick the items you want in the Selection tab and click Analyze to pull the deep metadata.
- “I ticked a workspace but some reports are missing.” Ticking a workspace scans the items inside it, but reports connected to a model in a different workspace won’t appear unless that workspace is also in scope. Ticking the semantic model is the safest approach — it automatically pulls in every connected report regardless of workspace.
- “The scan has been running for hours.” Phase 2 scales with the number of items you ticked. For large tenants, scan in batches and use Save & resume between sessions.
- “Used size / Potential savings columns are empty.” Those columns populate after Phase 3 (Analyze model usage). Run it from the toolbar after Phase 2 finishes.
- “The Broken visuals column shows N/A.” N/A means no count available — not zero. The count populates only after Phase 3 (Analyze model usage) has run on the report’s semantic model. Phase 3 runs per model, so reports whose model wasn’t included in the analysis stay N/A until you analyze it. N/A can also mean an error occurred while processing the model or the report.
Common workflows
- First inventory before a governance initiative. Run Phase 1 only — it finishes in minutes and gives you the full tenant inventory: how many workspaces, how many models, who owns what, which data sources are in use. Export the Workspaces and Tenant summary as a baseline before defining governance policies.
- Quarterly tenant audit. Run a full three-phase scan. Sort
Semantic models by % unused to find the biggest cleanup wins. Check
the Access tab for stale permissions. Review the Best practices
score to catch models that have drifted from standards. Save the
.measurekillerfile as a quarterly snapshot. - Pre-migration discovery before a Fabric move. Before migrating from Premium to Fabric, run a tenant scan to build the complete dependency map. The Lineage tab shows cross-workspace dependencies that would break if you move workspaces in the wrong order. The Semantic models tab shows storage modes — Import models may need conversion to Direct Lake.
- Clean up after a reorganization. After teams merge or split, run a tenant scan to find orphaned models (zero connected reports), duplicate models across the old and new workspaces (Model similarity), and stale permissions on the old team’s workspaces.
- Onboard a new BI lead. Hand them a saved
.measurekillerfile from a recent scan. They get the full picture of the tenant — every workspace, model, report, lineage path, and access assignment — without needing admin permissions themselves.
What to do with the findings
Tenant Analysis produces a deep export set — see the Exports overview for the full list. Common downstream uses:
- Feed the raw JSON exports into a governance dashboard, a data warehouse, or an AI model for prioritized optimization suggestions.
- Use the Workspaces + Access views as the input to an access-review process.
- Use Semantic models + DAX expressions as a pre-migration baseline before a Fabric move.
- Share the
.measurekillerfile with colleagues who need the data without running their own scan.
Related
- Run your first online scan — start here if you only need to scope to one shared semantic model
- Tenant summary — the aggregate item counts produced by Phase 1
- Access & permissions tracking — what the Access tab gives you (full Tenant Analysis only)
- Semantic model similarity score — Phase 2 follow-on
- Find broken DAX — the # of DAX errors column (after Phase 2)
- Find broken visuals — the Broken visuals column (after Phase 3)
- Capacity metrics — CU consumption per item and operation
- Report data exports — the ExportReport activity
- End-to-end data lineage in Power BI
- Tenant Analysis UI reference — every tab and panel explained