Semantic models inventory
Every semantic model from the scan — size, savings, CU use, DAX errors, refresh, storage mode, best-practice score — sortable to find the biggest cleanup wins.
Last updated · July 15, 2026
What you get
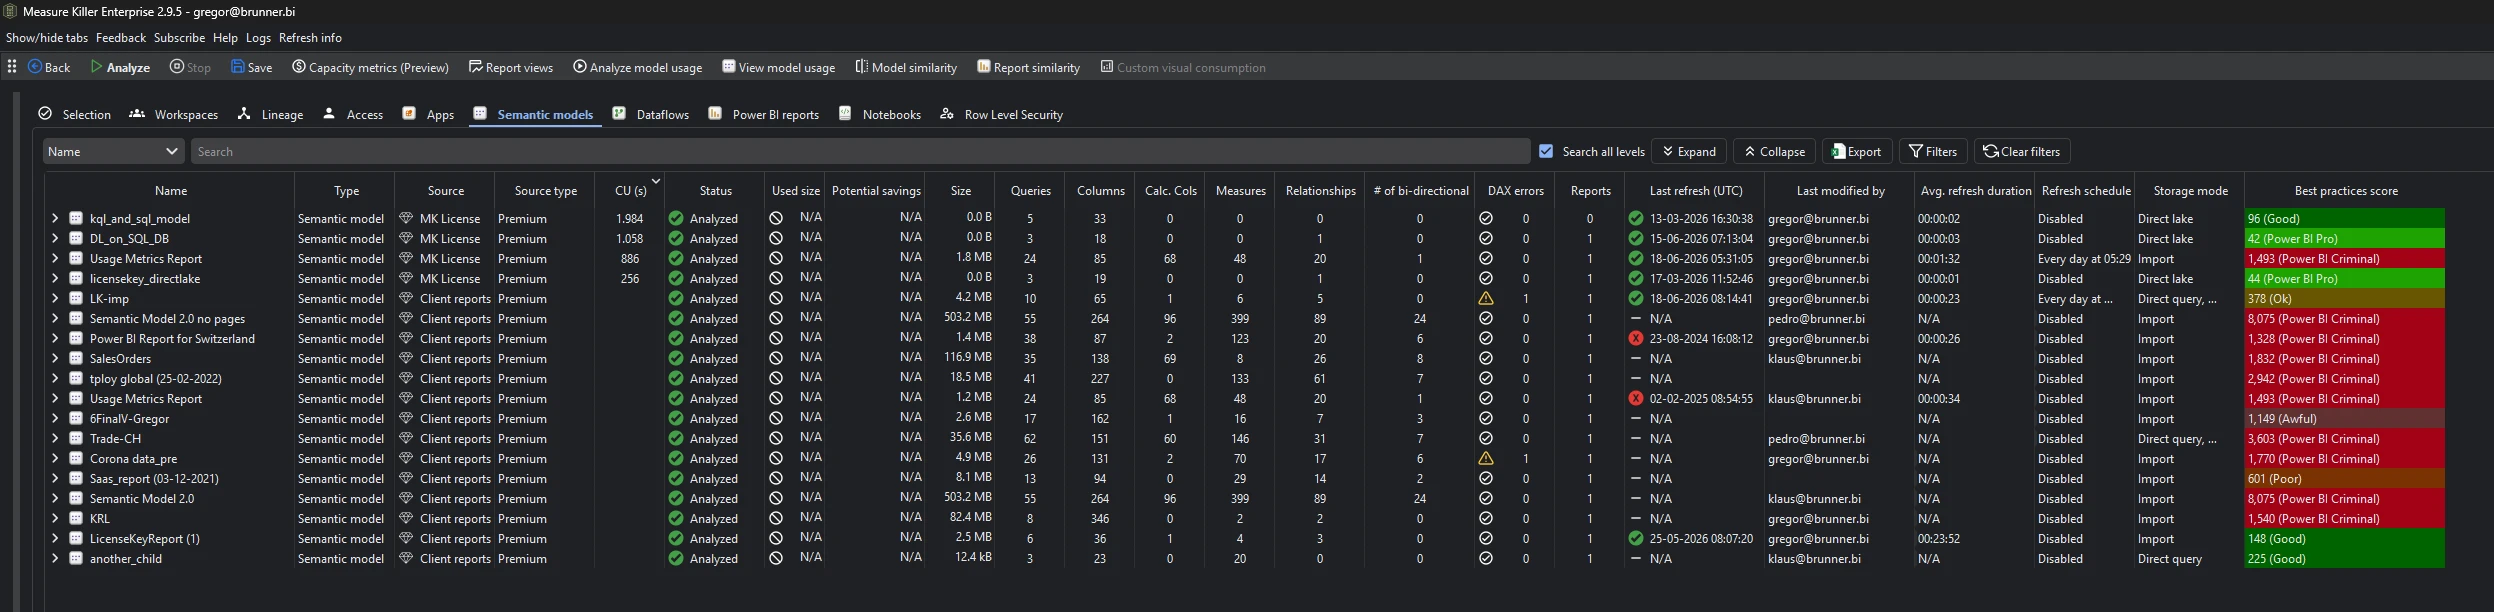
Every semantic model from the scan, with columns for:
- Name and workspace
- Size — the in-memory model size
- Used size / Potential savings — populated after running Analyze model usage (Phase 3)
- Queries, Columns, Calc. Cols, Measures, Relationships, # of bi-directional — object counts, including how many of the relationships are bi-directional
- Last refresh (UTC) — timestamp and success/failure status
- Last modified by — who last changed the model
- Avg. refresh duration — average refresh time
- Storage mode — Import, DirectQuery, Direct Lake, composite
- Best practices score — the model’s governance score from the best-practice analysis
- CUs (new in v2.9.5) — the model’s Capacity Unit consumption, populated after fetching Capacity metrics
- # of DAX errors (new in v2.9.5) — how many DAX expressions in the model currently contain errors. See Find broken DAX
To see where each of a model’s columns and measures actually land — down to the individual visual — use Measure Killer’s column-level data lineage.
Expand any model to drill into its tables, queries (including unloaded / auto date tables), relationships, and connected reports. The search bar — with Search all levels on by default — looks inside that expanded detail across every model at once: type a term and the list filters to just the models that contain it. After Phase 3, sort by Potential savings to find the biggest cleanup wins.
Right-click any model for several drill-ins:
- View end-to-end lineage — its upstream data sources and downstream reports and models (see End-to-end data lineage in Power BI).
- View refresh events — the model’s full refresh history (see Refresh events).
- Best practices — the full list of best-practice violations for that model, with details (see Best-practice analysis).
Run the analysis
- Run a tenant-wide scan and complete Phase 2 by selecting models and clicking Analyze.
- Switch to the Semantic models tab.
- Optionally run Analyze model usage from the toolbar (Phase 3) to populate the Used size and Potential savings columns (plus the Broken visuals column on the Power BI reports tab).
- Optionally fetch Capacity metrics from the toolbar to populate the CUs column (v2.9.5+, requires Capacity Admin on the capacity).
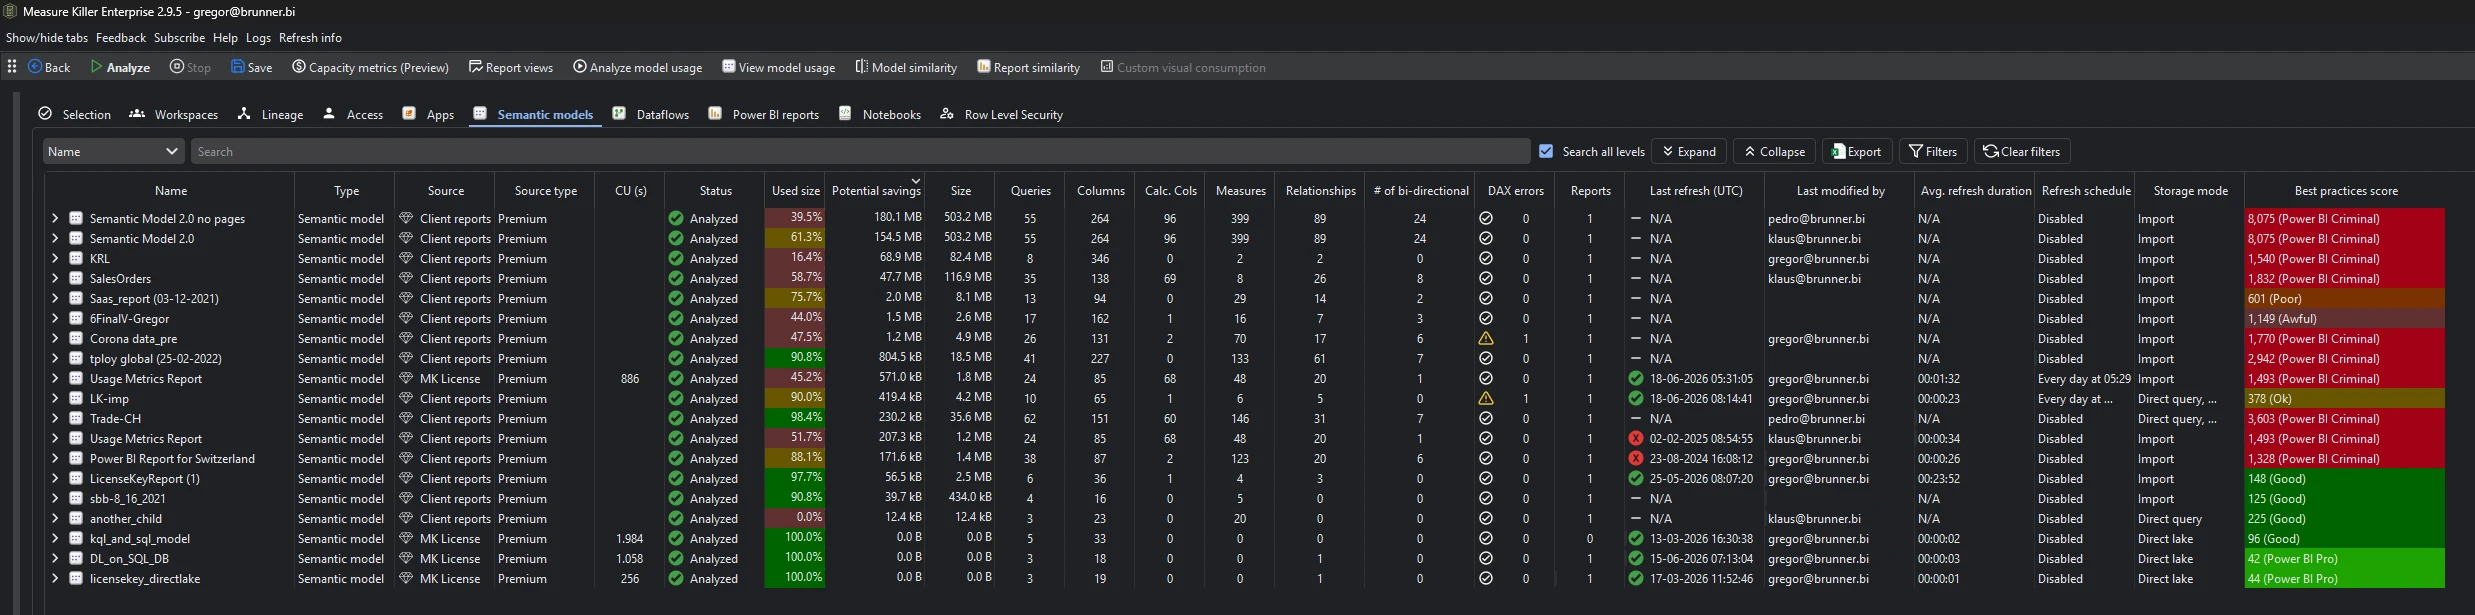
After running Analyze model usage, the Used size and Potential savings (% unused) columns fill in for every model:
What the columns mean
- Size — the in-memory footprint of the model. Import models show the VertiPaq size; DirectQuery and Direct Lake models show metadata size only.
- Used size — how much of the model is actually referenced by reports, other measures, or downstream consumers. Populated after Phase 3.
- Potential savings — the difference between Size and Used size — how much you could free by removing unused objects.
- Best practices score — a weighted violation score: the higher the number, the worse the model. Each model is rated from Power BI Pro (cleanest) through Good, Ok, Poor and Awful to Power BI Criminal (worst). See Best-practice analysis.
- Avg. refresh duration — average time for a full refresh, and often the single biggest win from cleanup. Every unused column and measure you remove is data the engine no longer has to load, compress, and recalculate on each refresh — so trimming a bloated model can cut refresh duration dramatically, on top of the memory and CU savings. After Phase 3 flags a model as mostly unused, the drop in refresh time is usually the most visible payoff.
- CUs — the model’s Capacity Unit (CU) consumption, from the capacity metrics data. Populated after fetching capacity metrics from the toolbar — see each model’s cost right next to its size, savings, and best-practices score. This column shows the default 14-day window; for CU history beyond that, open the Capacity metrics window, which accumulates a longer record. New in v2.9.5.
- # of DAX errors — the number of DAX expressions in the model (measures, calculated columns, calculated tables) that currently contain errors. Anything above zero means broken DAX worth fixing — see Find broken DAX, or use the DAX expressions tab to find the offending expressions. New in v2.9.5.
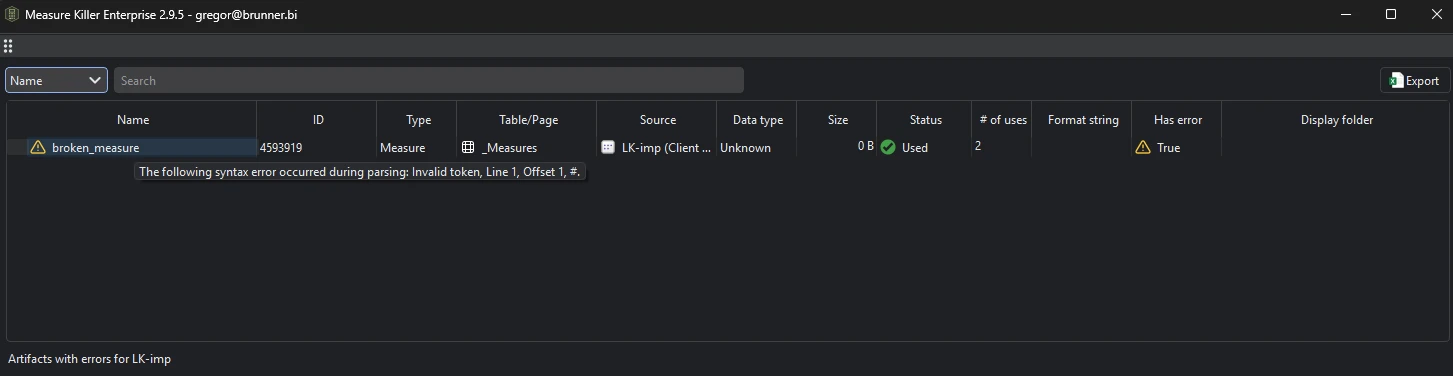
Drill into a model’s errors to see the artifacts with errors — each failing measure or calculated column, its status and uses, and the exact error message:
Common workflows
- Find the biggest cleanup wins. After Phase 3, sort by Potential savings (descending). The top rows are the models where removing unused objects frees the most space — which in turn cuts average refresh duration (usually the biggest, most visible win) and capacity cost. Compare the Avg. refresh duration and CUs columns before and after cleanup to quantify the payoff.
- Audit refresh health. Sort by Last refresh to find models with failed refreshes or stale data. Models that haven’t refreshed in weeks may be abandoned or broken.
- Find your most expensive models. After fetching capacity metrics, sort by the CUs column (descending). A model that is large, expensive, and mostly unused after Phase 3 is the strongest cleanup candidate in the tenant — and the Capacity metrics window shows why it’s expensive, down to the operation.
- Fix broken DAX. Sort by the # of DAX errors column to surface models with failing measures or calculated columns, then drill in to find the broken DAX or use the DAX expressions tab to locate and fix the offending expressions.
- Storage mode review. Filter by Storage mode to find which models consume a lot of CUs by sending tons of queries — e.g. those in DirectQuery or Direct Lake mode. Since v2.9.5 the CUs column shows that consumption directly.
- Best-practice triage. Right-click any model to see the full list of best-practice violations, with details, and fix them in priority order. Sort by the Best practices score column (higher = worse) to surface the worst offenders first.
- Hunt down a pattern across the tenant. Search inside the expanded
detail (Search all levels is on by default) — e.g. a
LocalDateTable/ auto date table, or a specific table or column name — and only the models containing it remain. To find models with bi-directional relationships, sort or filter by the # of bi-directional column. Either way you land straight on the offenders and can expand to see exactly what’s going on. - Drill into a single model. Select any model and click View model usage in the toolbar to see per-column, per-measure where-used detail — the same output a single-model online scan produces.
What to do with the findings
- Export to Excel — click Export in the toolbar to export the full semantic model inventory to Excel for offline analysis or capacity planning.
- Export as JSON — paid editions can also export as raw JSON for integration with governance dashboards, data catalogs, or capacity planning tools.
- Clean up via XMLA — use 1-click cleanup to remove unused objects from models directly in the Service, without downloading.
- Share the
.measurekillerfile — hand the scan to a colleague for review.
Related
- Find and remove unused measures and columns — the per-model deep dive
- Best-practice analysis — the rules behind the Best practices score
- Capacity metrics — the data behind the CUs column, with the per-operation breakdown
- Find broken DAX — drill into the failing measures, calculated columns, and calculated tables behind the # of DAX errors count
- DAX expressions — find the expressions behind the # of DAX errors count
- Semantic model similarity score — find duplicates across models
- Clean your model — step-by-step cleanup suggestions
- Run a tenant-wide scan — the scan that populates this tab