Capacity metrics — what's driving your Fabric / Premium bill
Break down Capacity Unit (CU) use per workspace, item, and operation across your Fabric and Premium capacities — with 24h/7-day trends and history beyond 14 days.
Last updated · July 7, 2026
Availability: Capacity metrics (Preview) — Measure Killer v2.9.5 and later.
What you get
Capacity metrics shows Capacity Unit (CU) consumption across your Fabric and Premium capacities — broken down far enough to answer the question Microsoft’s own metrics app makes hard: which items are actually driving the cost, and is that going up or down?
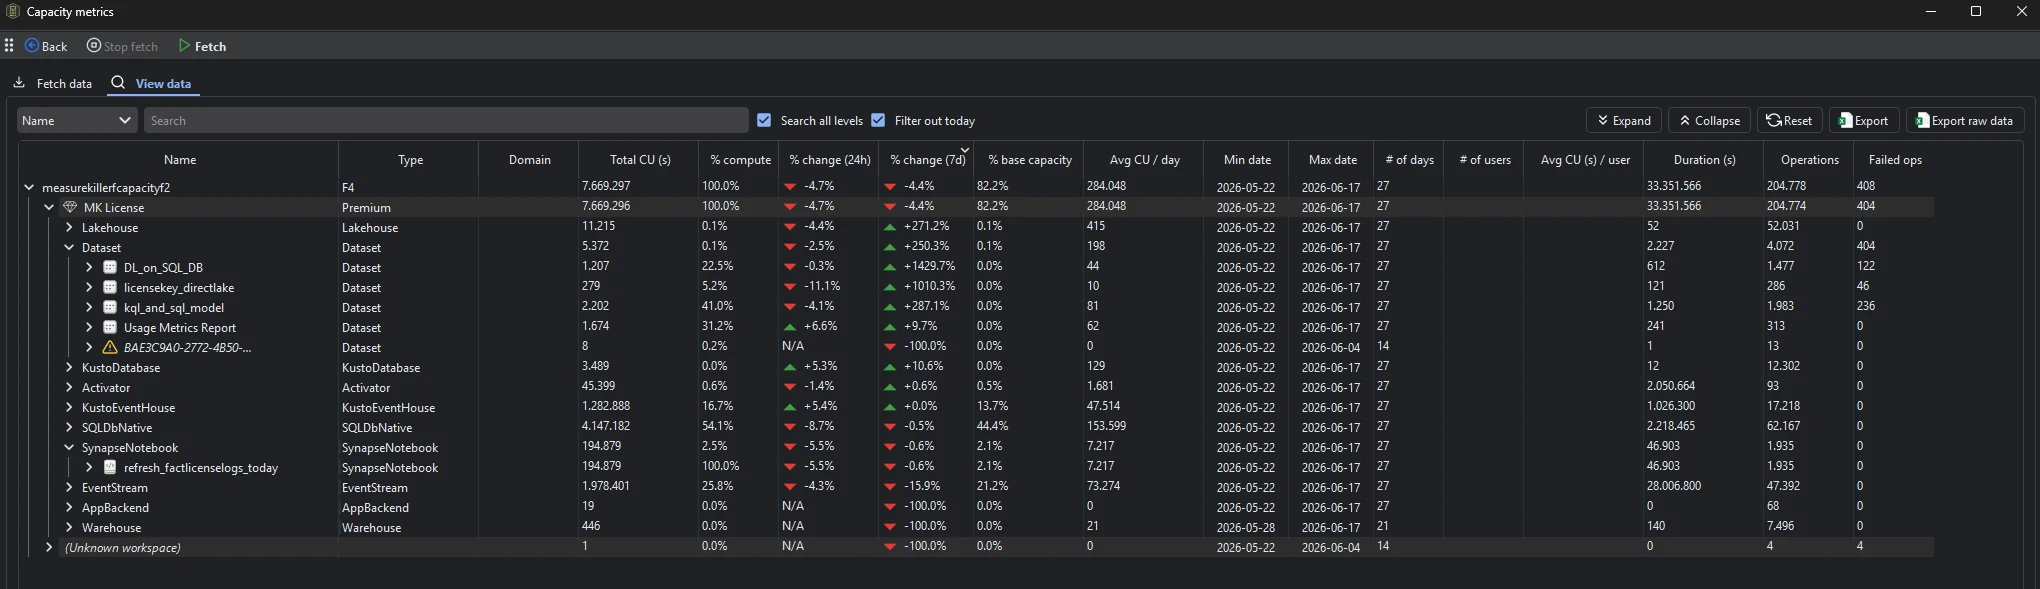
Every row carries the same set of metrics, so you can read the same numbers at the capacity level, the workspace level, the item-type level, the individual-item level, and the per-operation level:
- Total CU (s) — total Capacity Units consumed over the period
- % compute / % base capacity — that item’s share of compute, and its consumption as a percentage of the capacity’s base allowance
- % change (24h) / % change (7d) — trend arrows so you can spot what spiked in the last day or week
- Avg CU / day and Avg CU (s) / user — normalized views for comparing items of different sizes and audiences
- Min date / Max date / # of days — the window the data covers
- # of users, Duration (s), Operations, and Failed ops
Because the same metrics repeat at every level, you can start at the capacity total and drill straight down to the single operation that moved the number.
Once fetched, each semantic model’s CU consumption also surfaces as a CUs column directly in the Semantic models tab — so you can sort models by cost right next to their size, potential savings, and best-practices score without opening the Capacity metrics window.
How to read the hierarchy
The grid is a tree. Expand any row to go one level deeper:
- Capacity — the F-SKU or Premium capacity (e.g. an
F4), with its total consumption at the top. - Workspace — every workspace running on that capacity, with its capacity type (Premium, PPU, Fabric).
- Item type — within a workspace, consumption grouped by type: semantic models (Dataset), Lakehouse, KustoDatabase, KustoEventHouse, EventStream, SynapseNotebook, Activator, SQLDbNative, and so on.
- Item — the individual semantic model, notebook, lakehouse, or other item.
- Operation — the lowest level of the tree: the individual operation name that consumed the CUs (Query, OneLake/Background, refresh, bulk operations, etc.). It isn’t shown in the screenshot above — expand an item all the way down to reach it — but it’s the deepest detail the window provides, telling you exactly which operation drove an item’s cost.
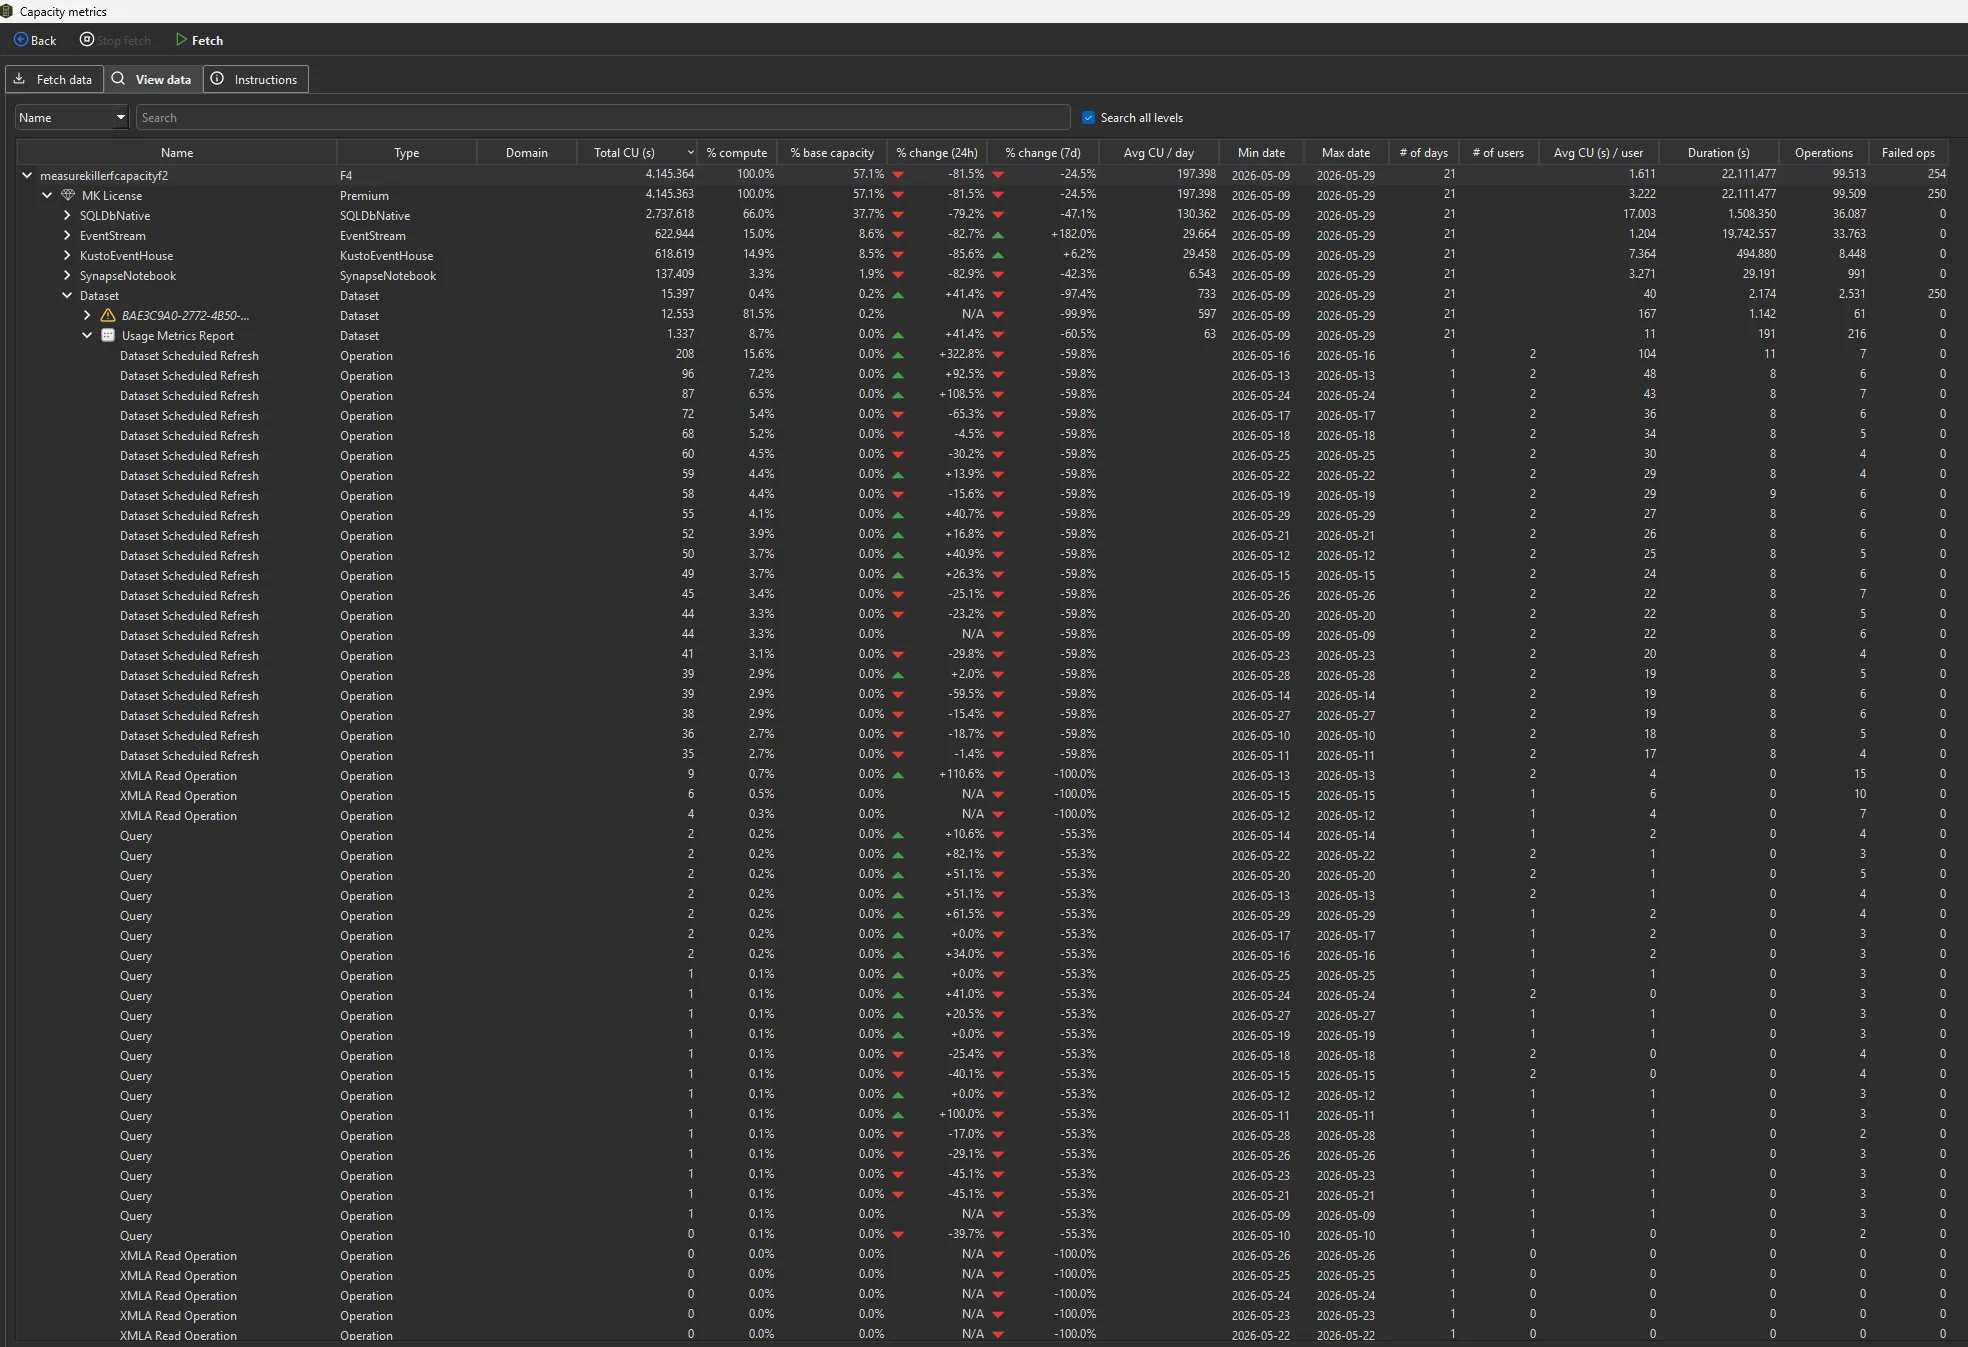
Drilling to the operation level is what turns “this model is expensive” into “this model is expensive because of a background refresh running every few minutes” — the detail you need to actually fix the cost. For Power BI reports, a chunk of that consumption is often report subscriptions rendering on a schedule rather than anyone opening the report.
Find your way around the grid
The View data tab gives you the tools to navigate a large capacity:
- Search with Search all levels ticked finds an item or operation anywhere in the tree, not just at the top level.
- Expand / Collapse open or close the whole tree at once; Reset returns to the default view.
- Click any column header to sort — sort by Total CU (s) to put the biggest cost drivers at the top, or by % change (7d) to find what’s trending up.
Permissions — what you actually need
Capacity metrics is one of the few Measure Killer features that does not require a Fabric / Power Platform Administrator. Instead you need:
- Capacity Admin on the capacity you want to read — this is what authorizes access to the capacity’s CU metrics.
- Contributor (or higher) on the workspaces whose items you want named and typed in the breakdown.
This means a capacity owner can analyze their own capacity’s spend without tenant-wide admin rights — including from Limited Tenant Analysis mode. Workspaces you only have Capacity Admin (but not Contributor) access to will still show consumption, but item-level naming may be limited.
Fetch the data
Capacity metrics has its own Fetch data step because the CU data comes from a different API than the rest of the tenant scan.
- Run a tenant-wide scan and open the Capacity metrics window from the toolbar. (Tip: tick Capacity Metrics (Preview) → Auto-fetch capacity metrics in the pre-filters before you scan and the CUs columns populate automatically — see the note below.)
- On the Fetch data tab, start the fetch with Fetch. Measure Killer pulls the available CU history for the capacities in scope. Use Stop fetch to cancel a long-running pull.
- Switch to View data to read the breakdown once the fetch completes. The Instructions tab has in-app guidance if you get stuck.
Auto-fetch during Phase 2. If you turned on Capacity Metrics (Preview) → Auto-fetch capacity metrics in the pre-filters before the scan, you can skip this manual step: selecting a semantic model (or report) in the Selection tab and running Phase 2 pulls that item’s CU consumption automatically — the same pass that pulls the connected reports’ opens, page views, and average load times — so the CUs columns populate without opening this window. See Run a tenant-wide scan → Phase 2.
How the 14-day limit works — and how Measure Killer extends it
Microsoft only retains 14 days of capacity metrics. Like
report opens and activity logs, Measure Killer works around this by
storing every fetch in a local SQLite database in your %APPDATA%
folder and merging fresh results on each run — new days are
appended, overlapping days are updated.
Fetch the capacity metrics every week or two — before each 14-day window rolls off — and your CU history grows past the window Microsoft retains, giving you a continuous record of what each item cost over time. There’s no setting to enable and no separate database to provision — it accumulates automatically in every paid edition each time you run the fetch.
For unattended collection, MK Automation runs the same fetch on a schedule inside your Fabric tenant and writes the results to Fabric Lakehouse / Warehouse tables — ready for Databricks, Snowflake, or a Power BI cost report.
Export the data
The View data toolbar offers two exports (paid editions only — disabled during the trial):
| Export | What’s in it |
|---|---|
| Export | Exactly what you see in the grid — every level fully expanded, including the calculated fields (% change 24h / 7d, averages, % compute, and so on) |
| Export raw data | The underlying records behind the grid, without the calculated fields — the raw consumption data for your own analysis in Excel, a warehouse, or a dashboard |
The capacity metrics are also part of the full JSON export bundle — see the Exports overview.
Common workflows
- Find the most expensive items. Sort by Total CU (s) descending to put your biggest cost drivers at the top, then drill into the operations to see why each one is expensive.
- Catch a runaway cost early. Sort by % change (7d) or % change (24h) to surface items whose consumption has jumped — often a misconfigured refresh, a new heavy report, or a runaway notebook.
- Right-size a capacity. Compare % base capacity across workspaces to see who’s consuming the capacity you’re paying for — evidence for splitting a workspace onto its own capacity or consolidating underused ones.
- Chargeback by workspace. Export the per-workspace breakdown to attribute capacity cost back to the teams that own each workspace.
- Investigate failed operations. A high Failed ops count points at operations that consumed capacity without succeeding — worth fixing both for reliability and for the wasted CUs.
Troubleshooting
”Missing column…” / “Could not find column…” on fetch
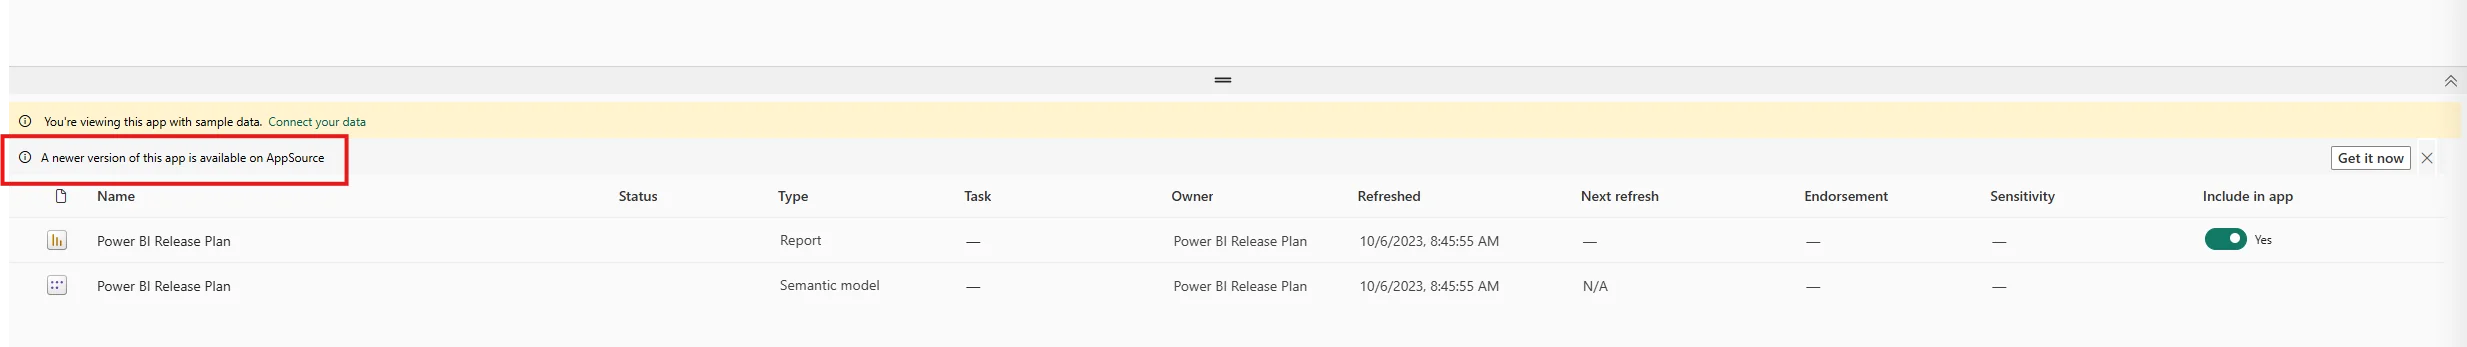
If Measure Killer shows an error like “missing column …” or “could not find column …” when you start the capacity-metrics fetch, it’s most likely because your tenant is running a different (usually older) version of the Microsoft Fabric Capacity Metrics app than Measure Killer expects. Microsoft, unfortunately, periodically renames or restructures the columns in that app’s semantic model, so an out-of-date app no longer lines up with what Measure Killer reads.
Fix: update the Microsoft Fabric Capacity Metrics app to the latest version, then run the fetch again. Open the app’s workspace in the Power BI / Fabric service — when an update is available you’ll see a banner “A newer version of this app is available on AppSource” with a Get it now button on the right; click it to update.
Related
- Run a tenant-wide scan — the scan that capacity metrics is fetched alongside
- Consumption & usage — the wider “what’s actually used?” picture that capacity metrics feeds into
- Semantic models inventory — pair model usage with its CU cost to find expensive, under-used models
- Report views & opens — the same SQLite database accumulates consumption history beyond the 14-day window
- Report subscriptions — scheduled subscription sends are a common hidden driver of the report CU consumption you see here
- Audit personal workspaces — find personal workspaces sitting on a paid Premium / Fabric capacity
- Exports overview — full list of exports, including capacity metrics
- MK Automation — scheduled, unattended capacity-metrics collection written to Fabric tables or your data warehouse