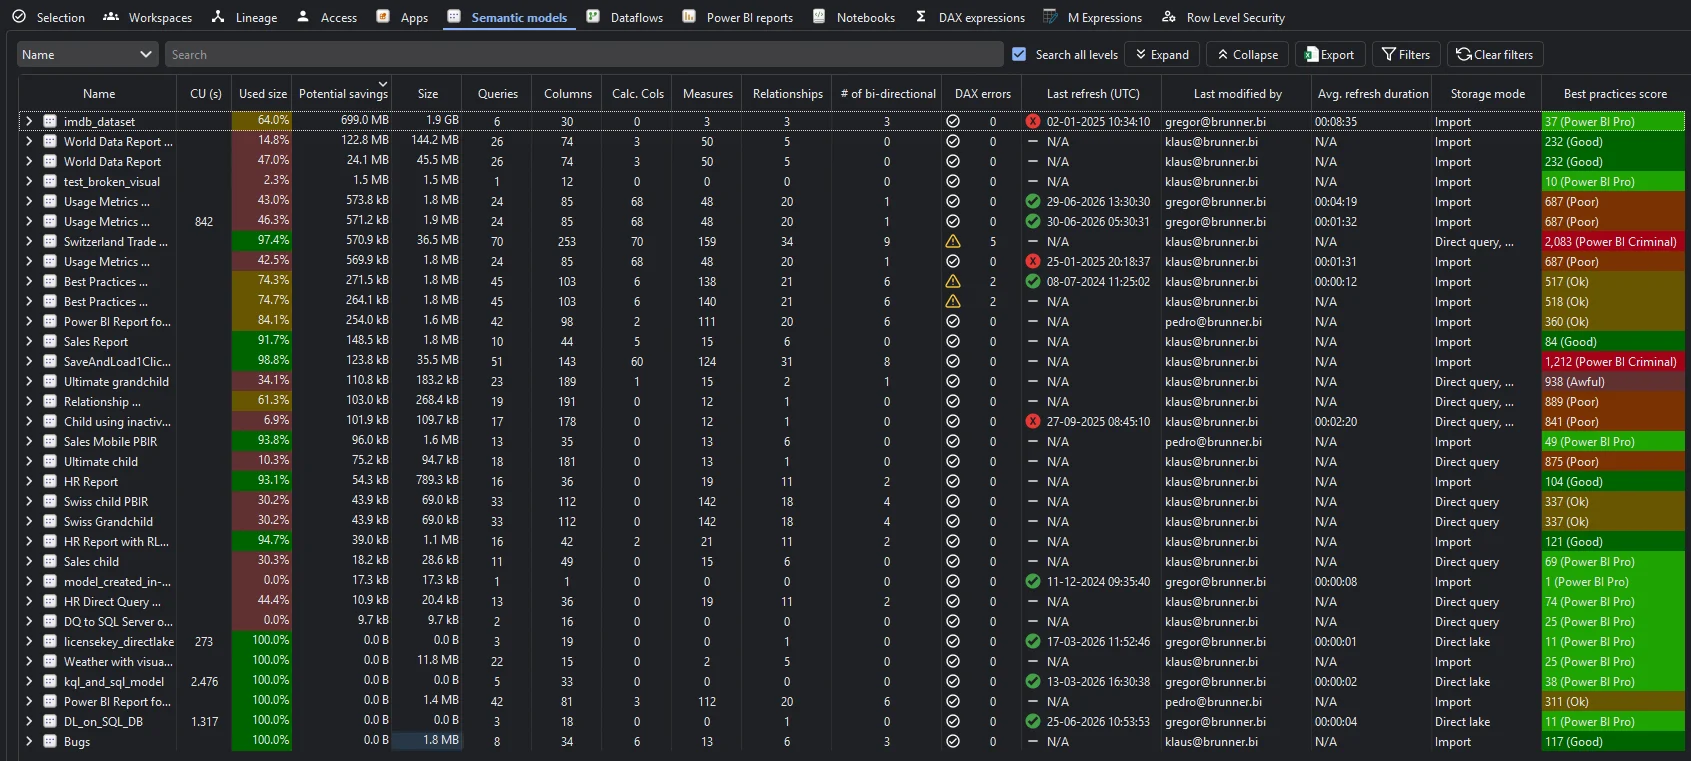
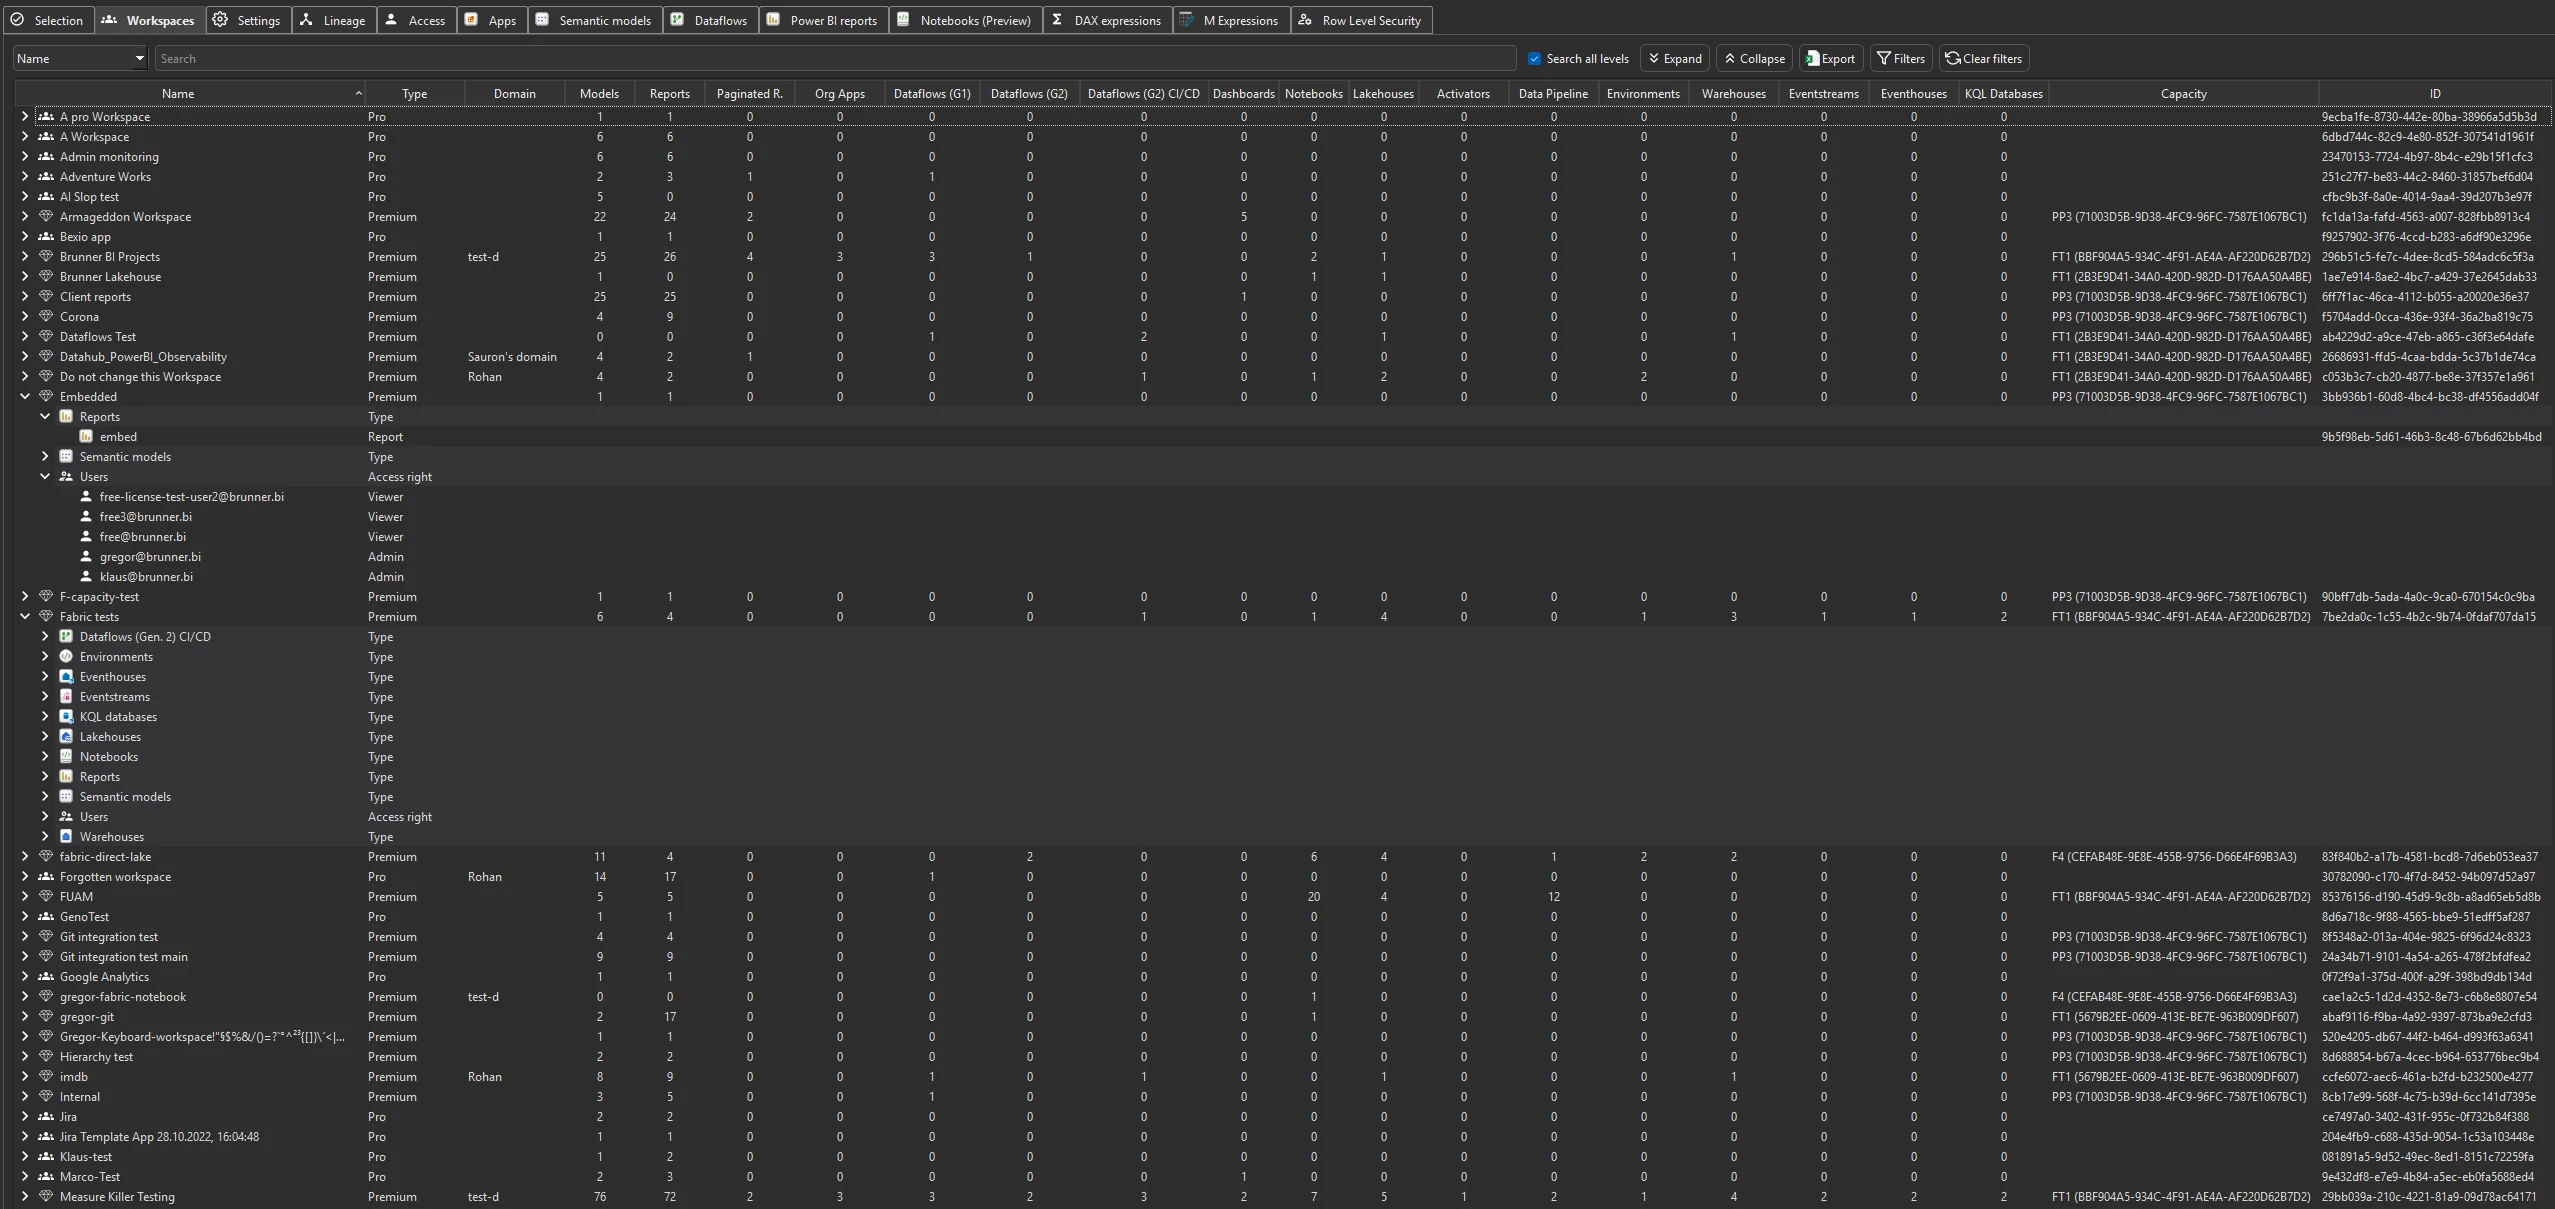
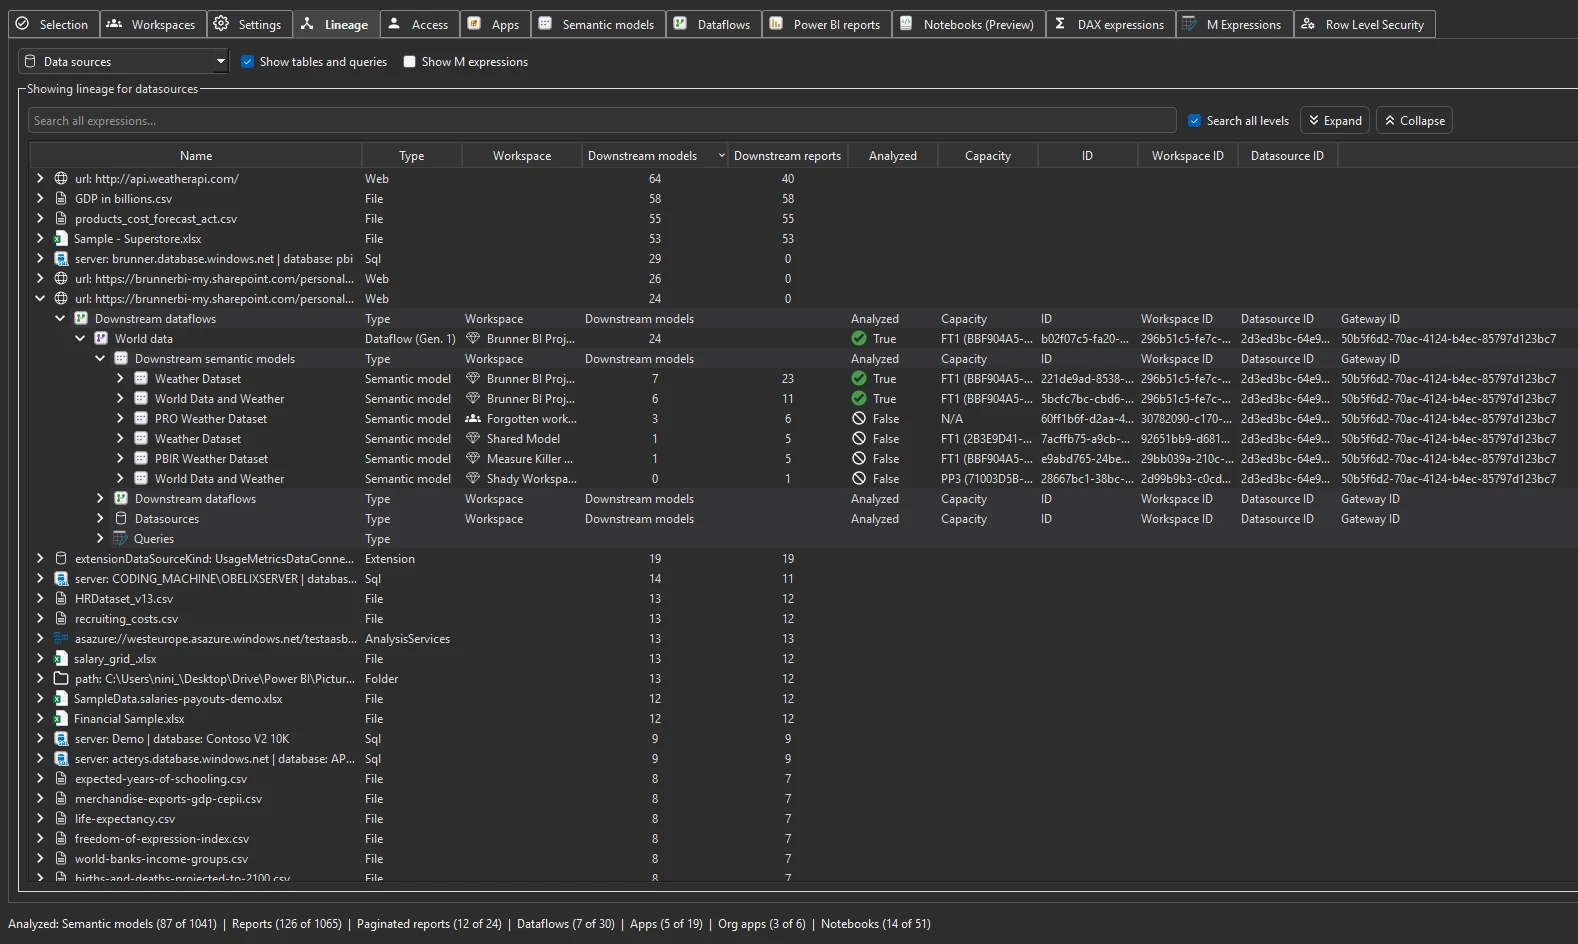
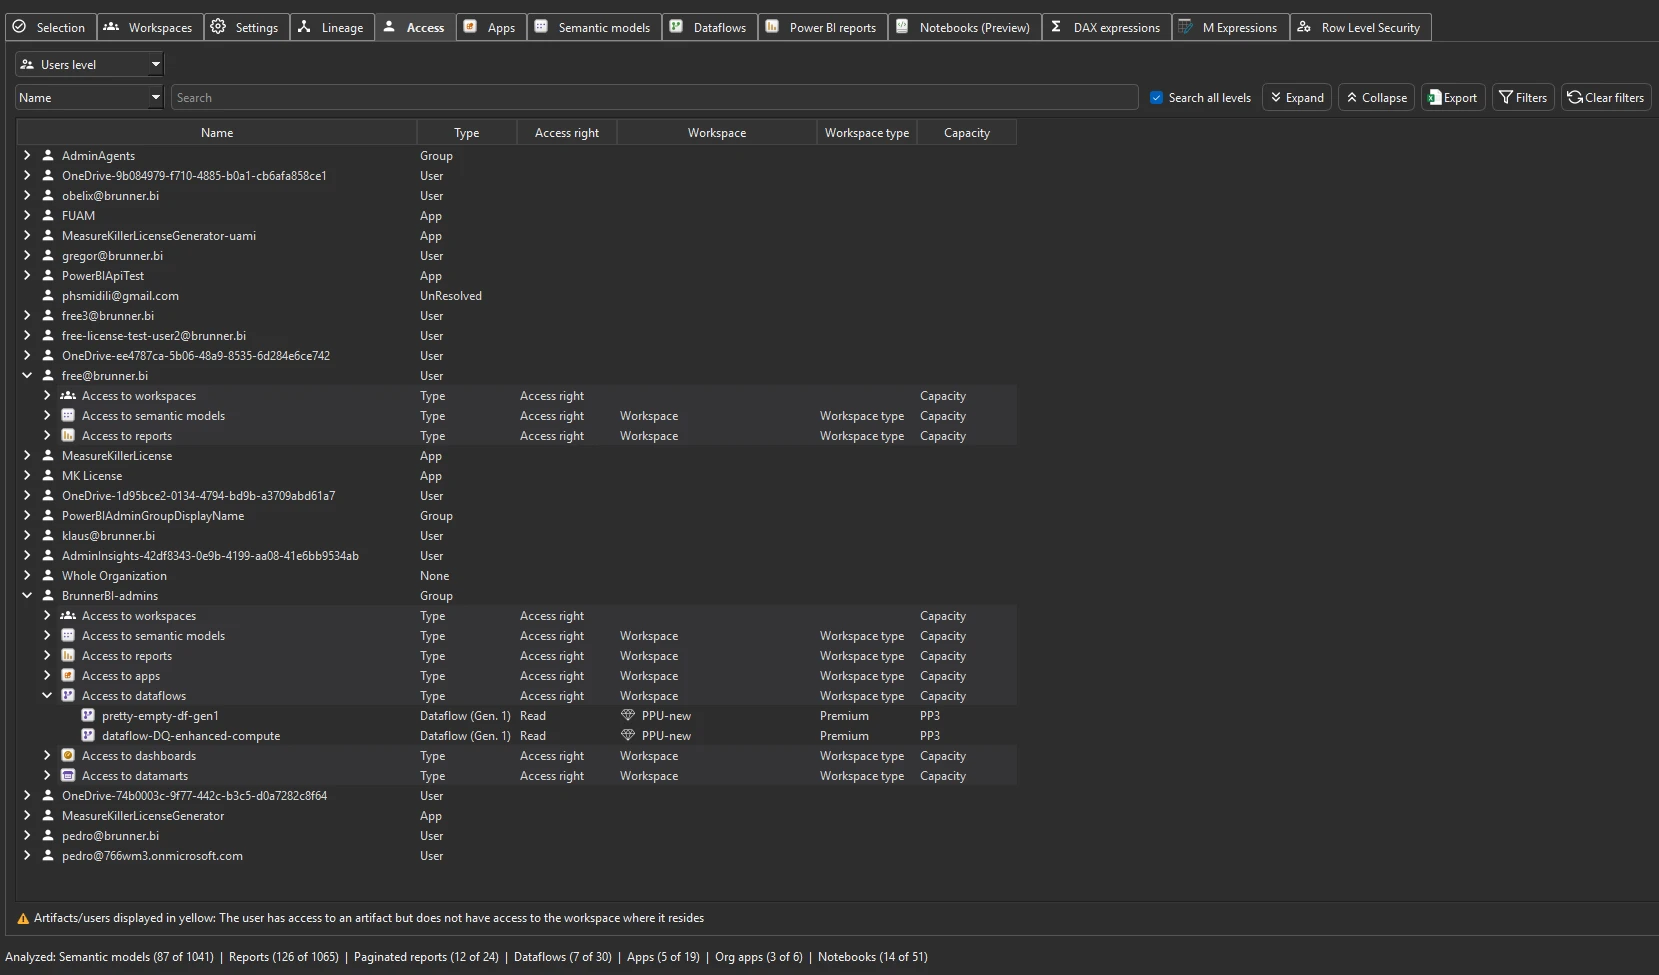
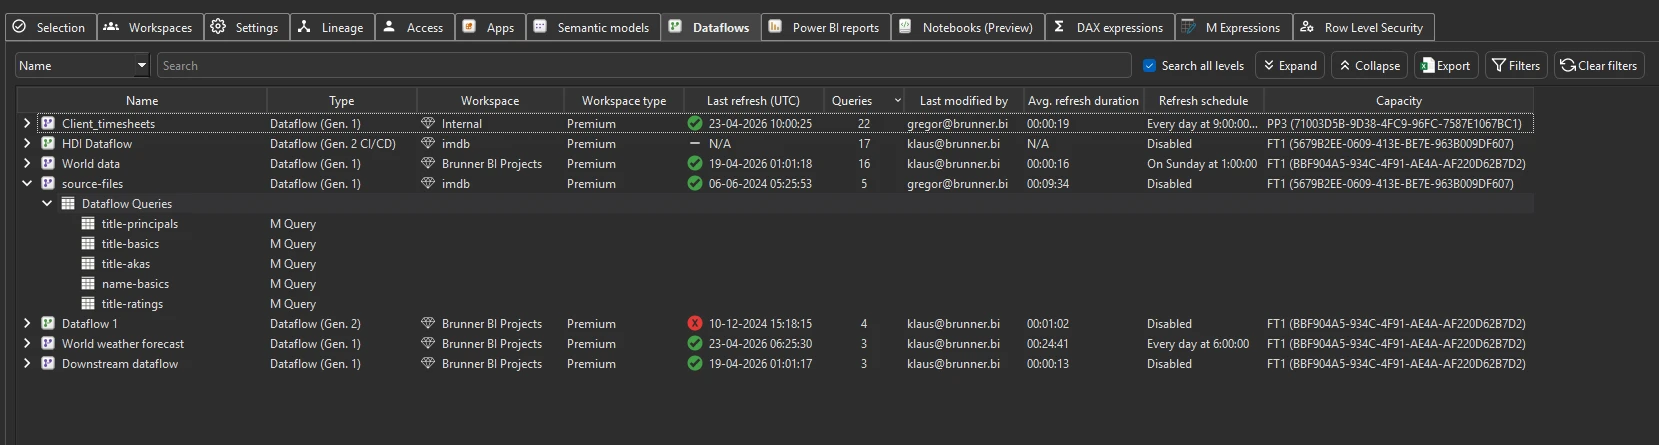
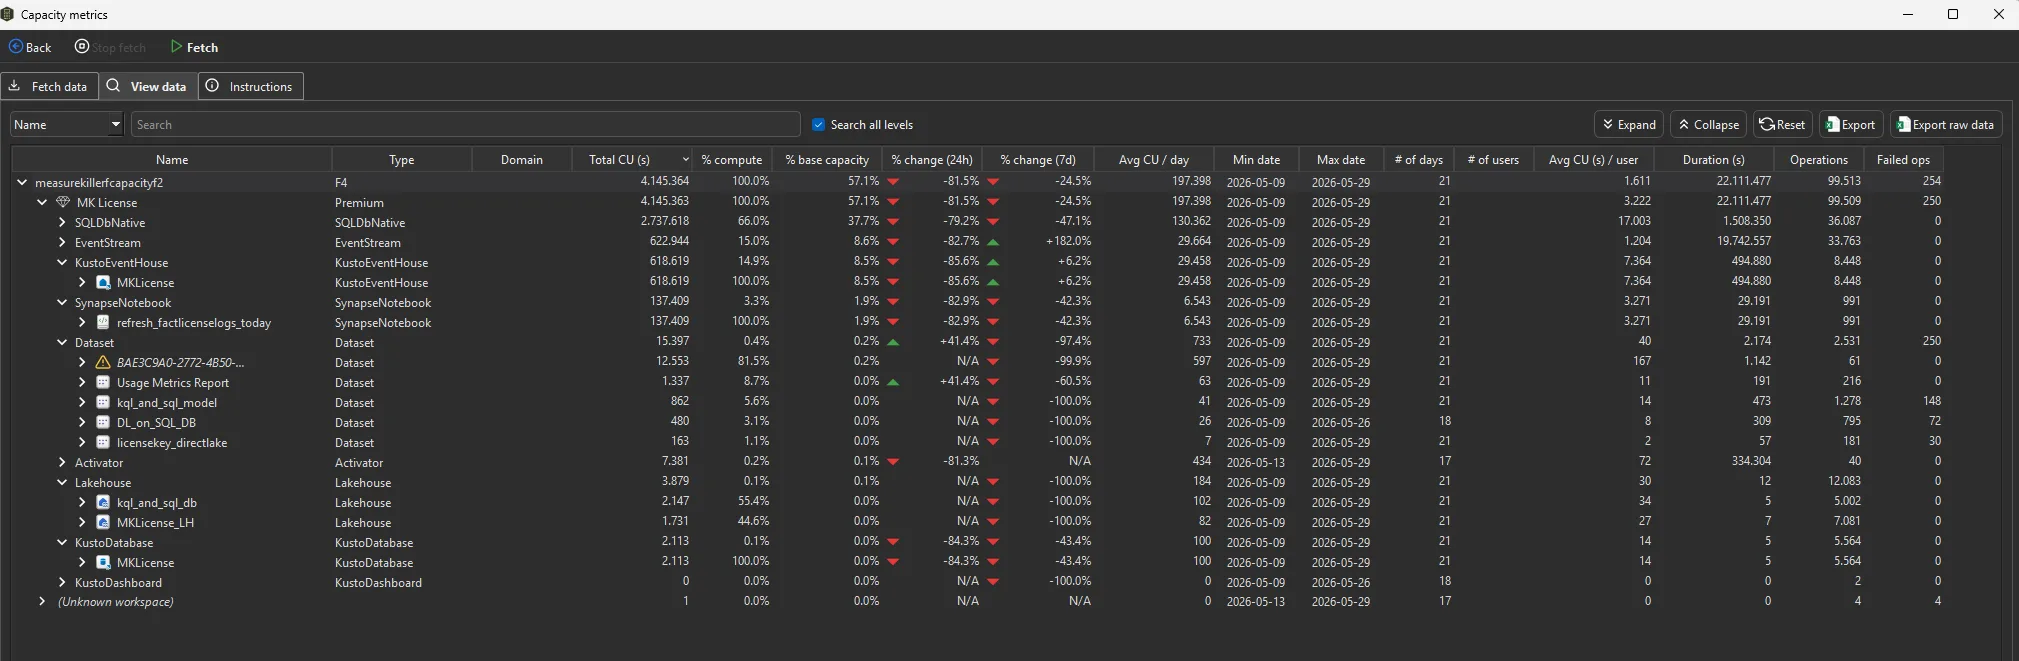
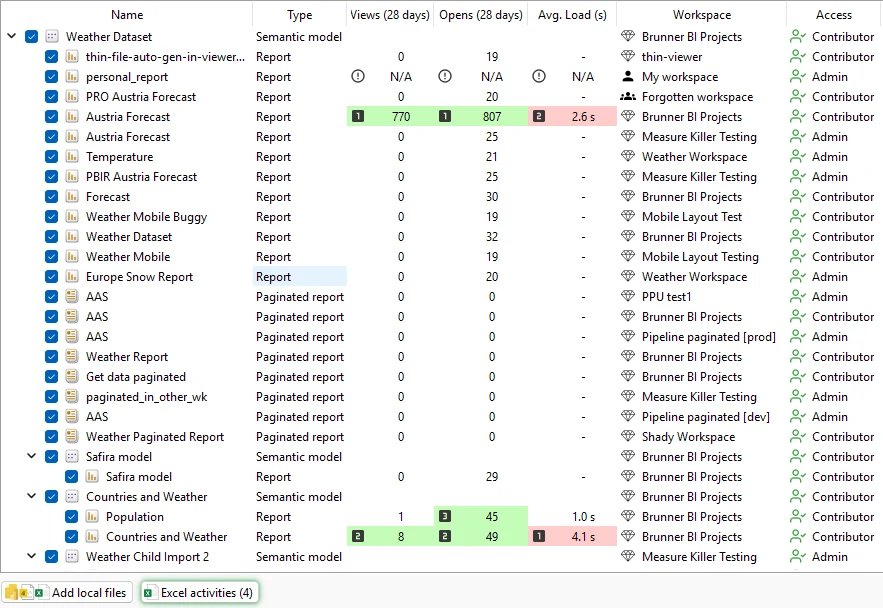
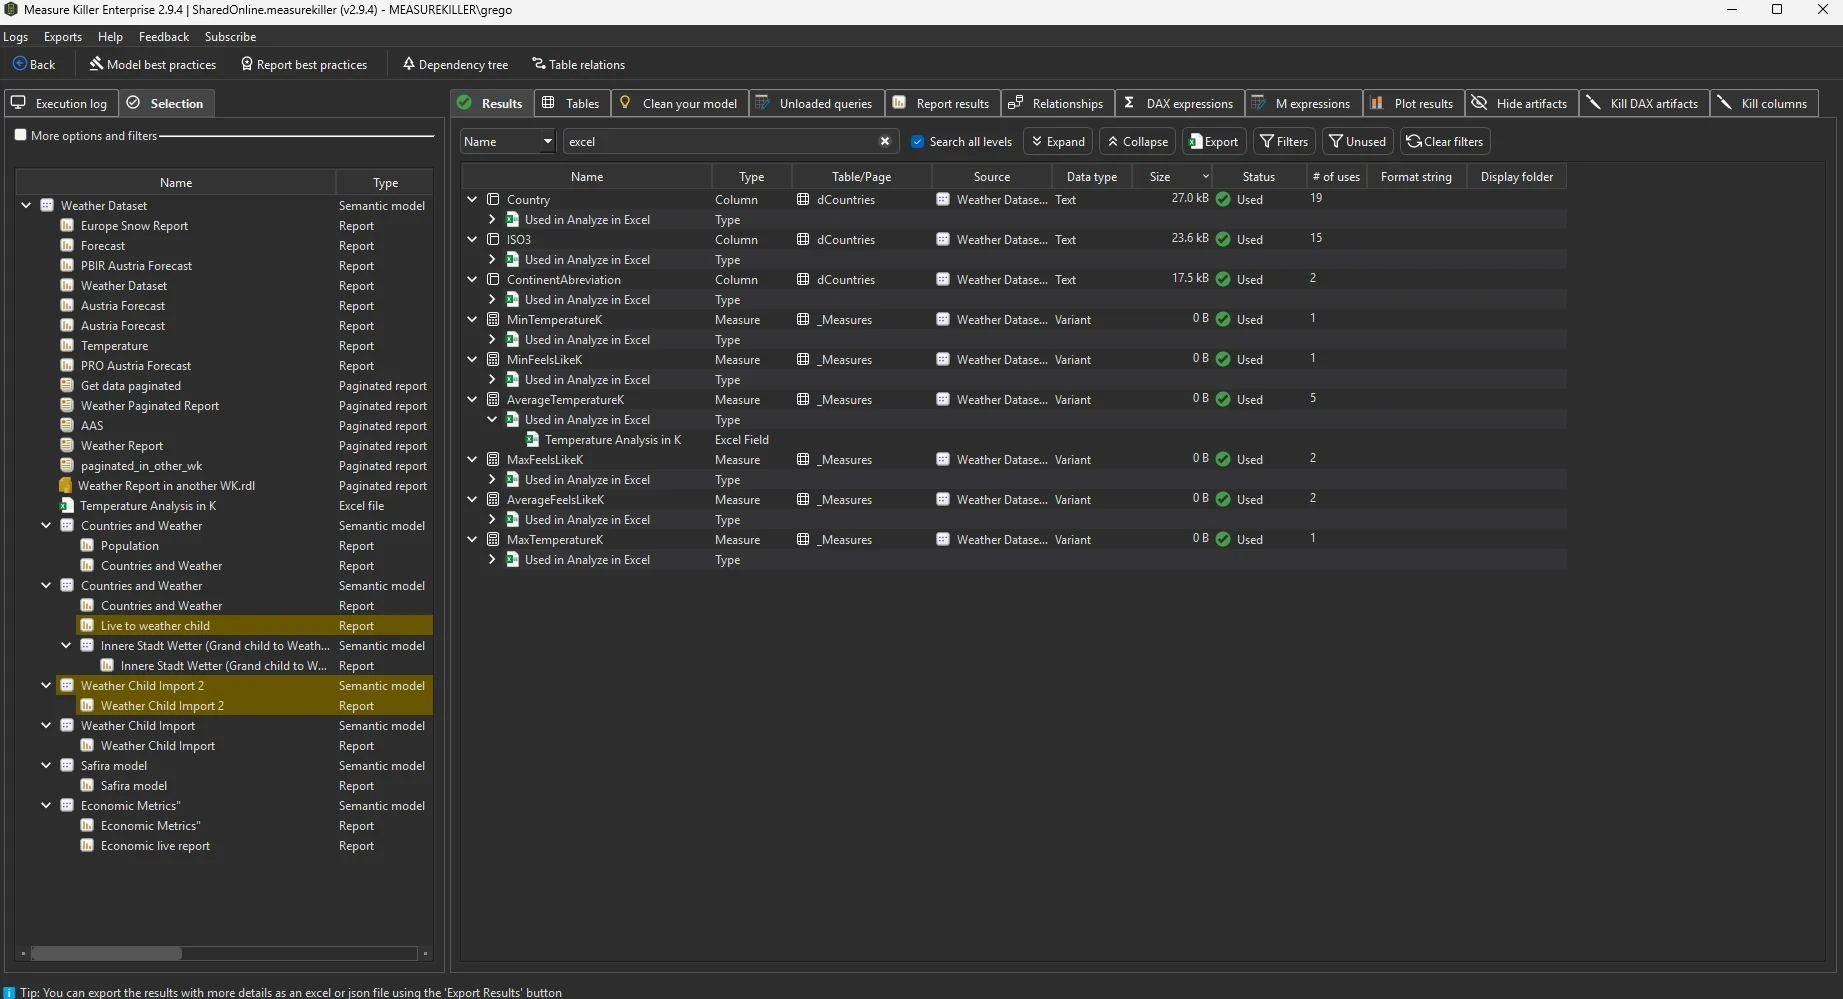
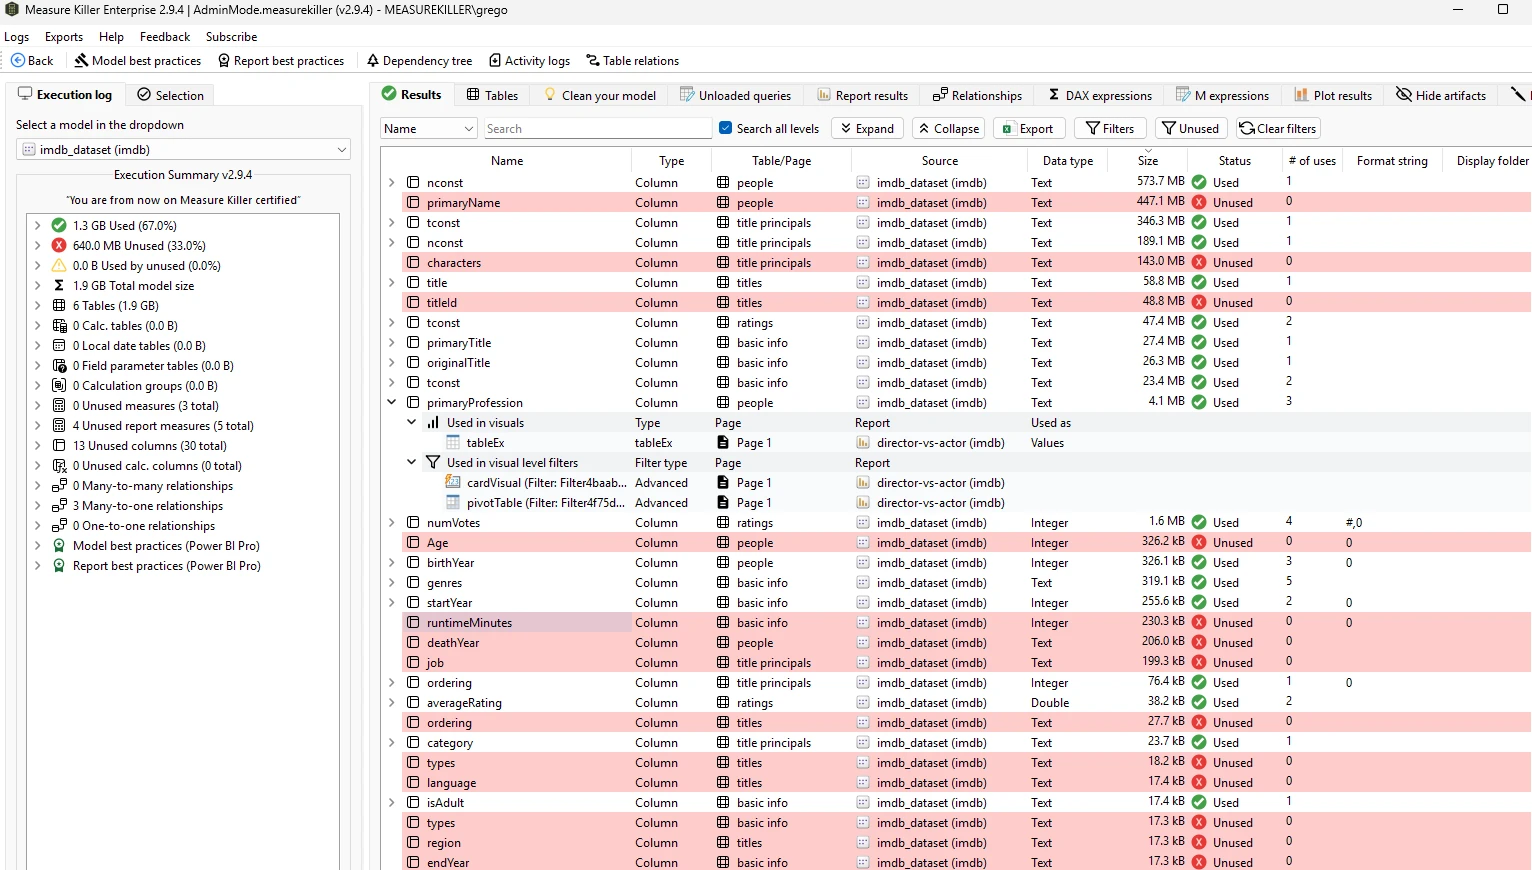
End-to-end lineage — database to visual
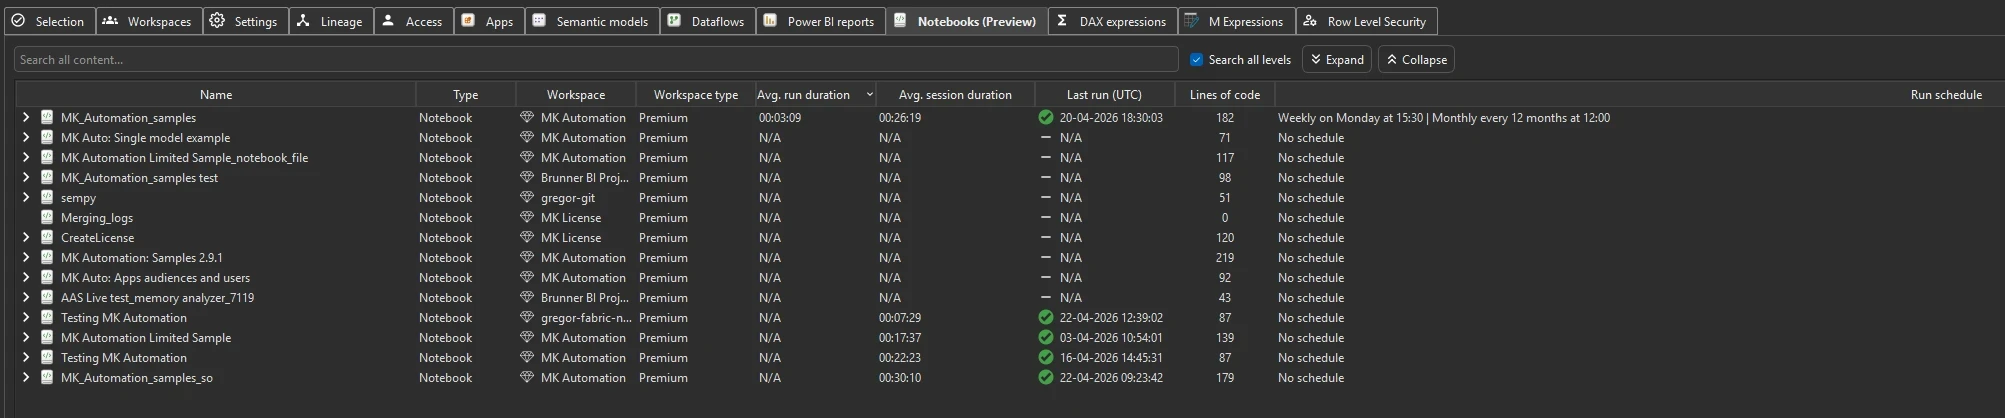
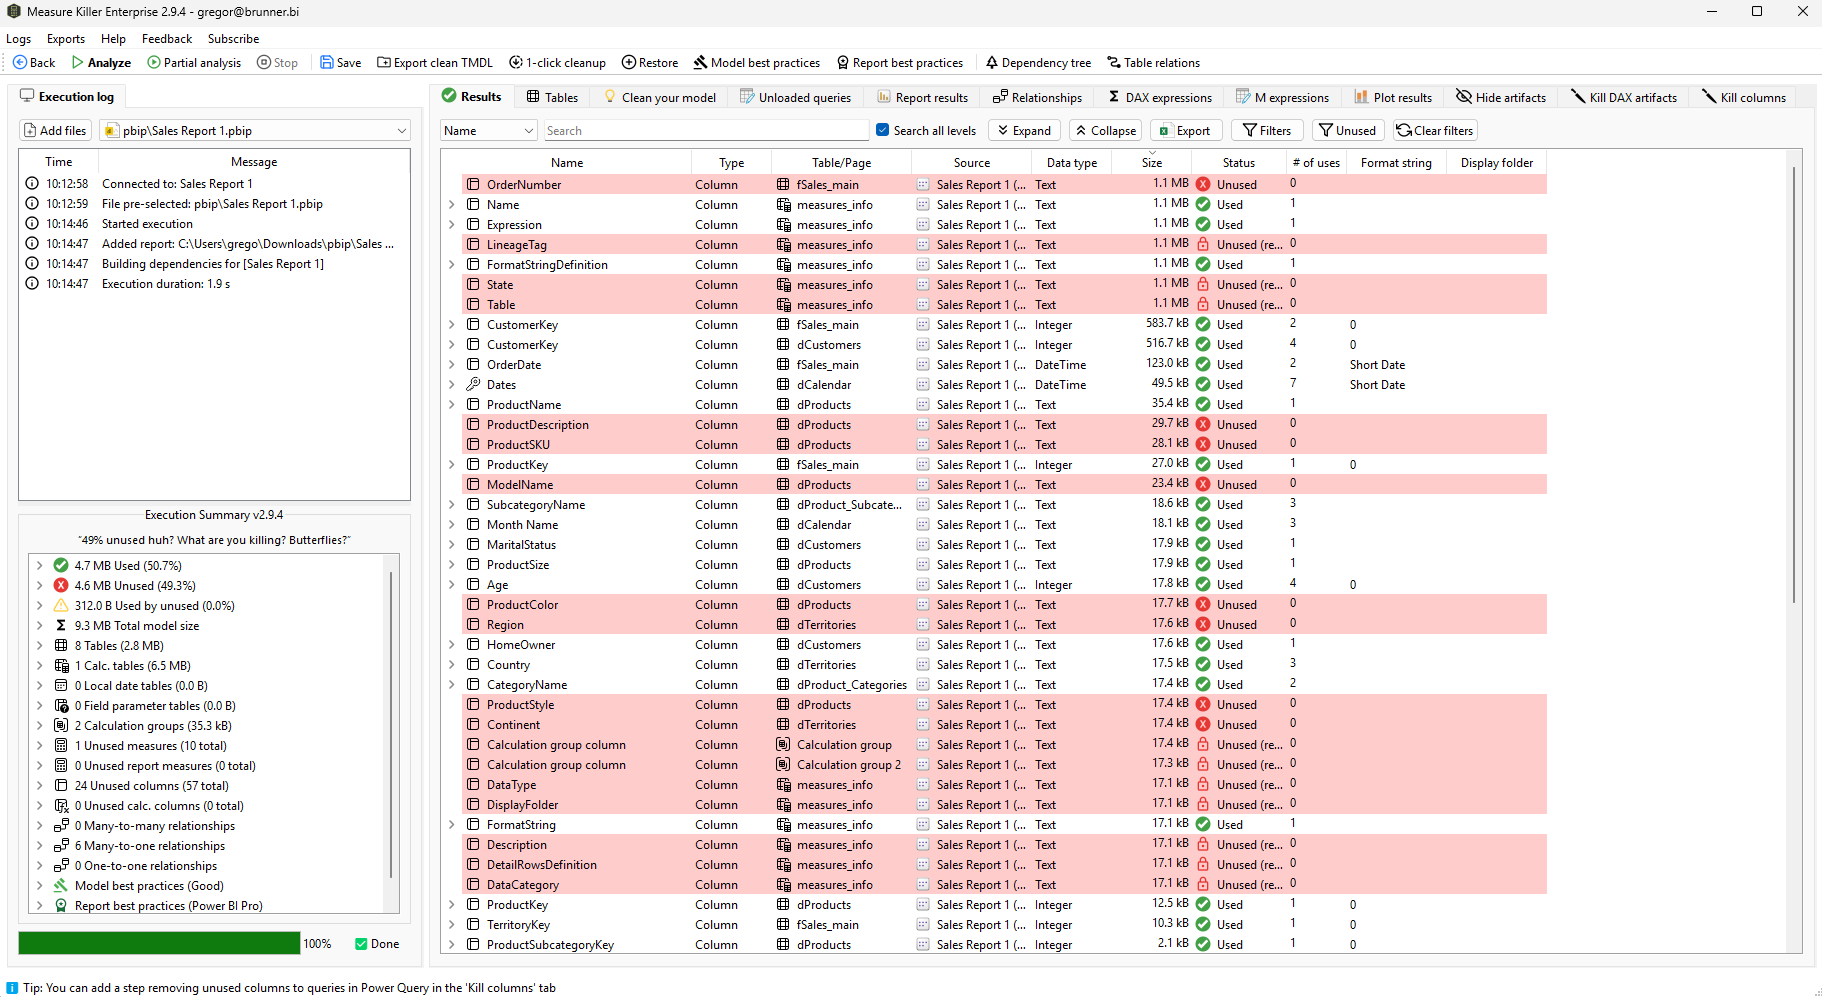
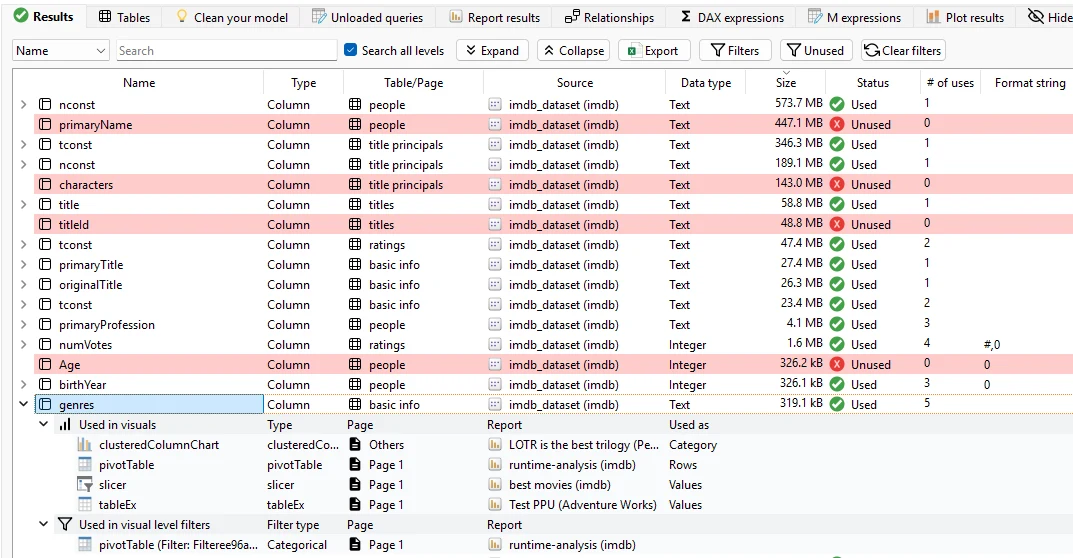
Follow a database table, view — or even an individual column — from ingestion into Power BI all the way down to the visual that displays it. Column-level source lineage no other tool offers.
- Column-level across the whole chain: database → dataflow → semantic model → report → visual — an industry first
- Works across SQL Server, Snowflake, Fabric Warehouse & Lakehouse, PostgreSQL and more
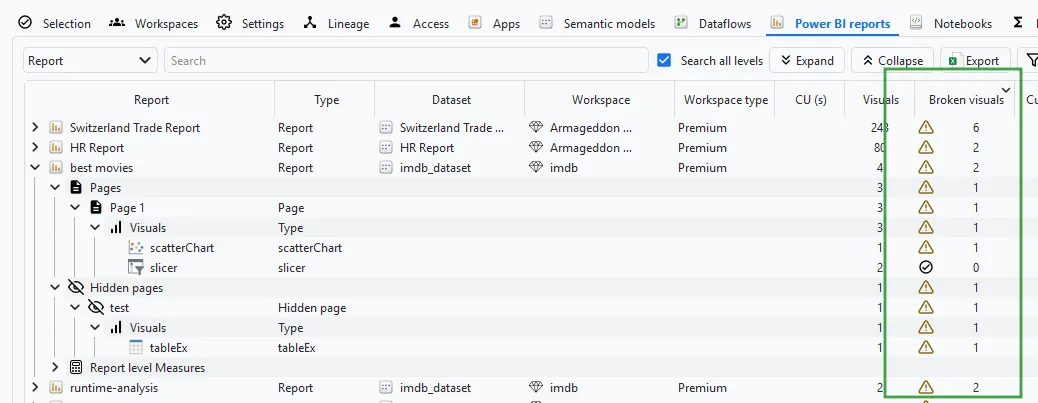
- See exactly what breaks downstream before you change a source table or column