 Measure Killer
Tutorials, deep-dives, and product updates.
Writing on Power BI / Fabric governance, model optimization, and what's new in Measure Killer.
9 posts
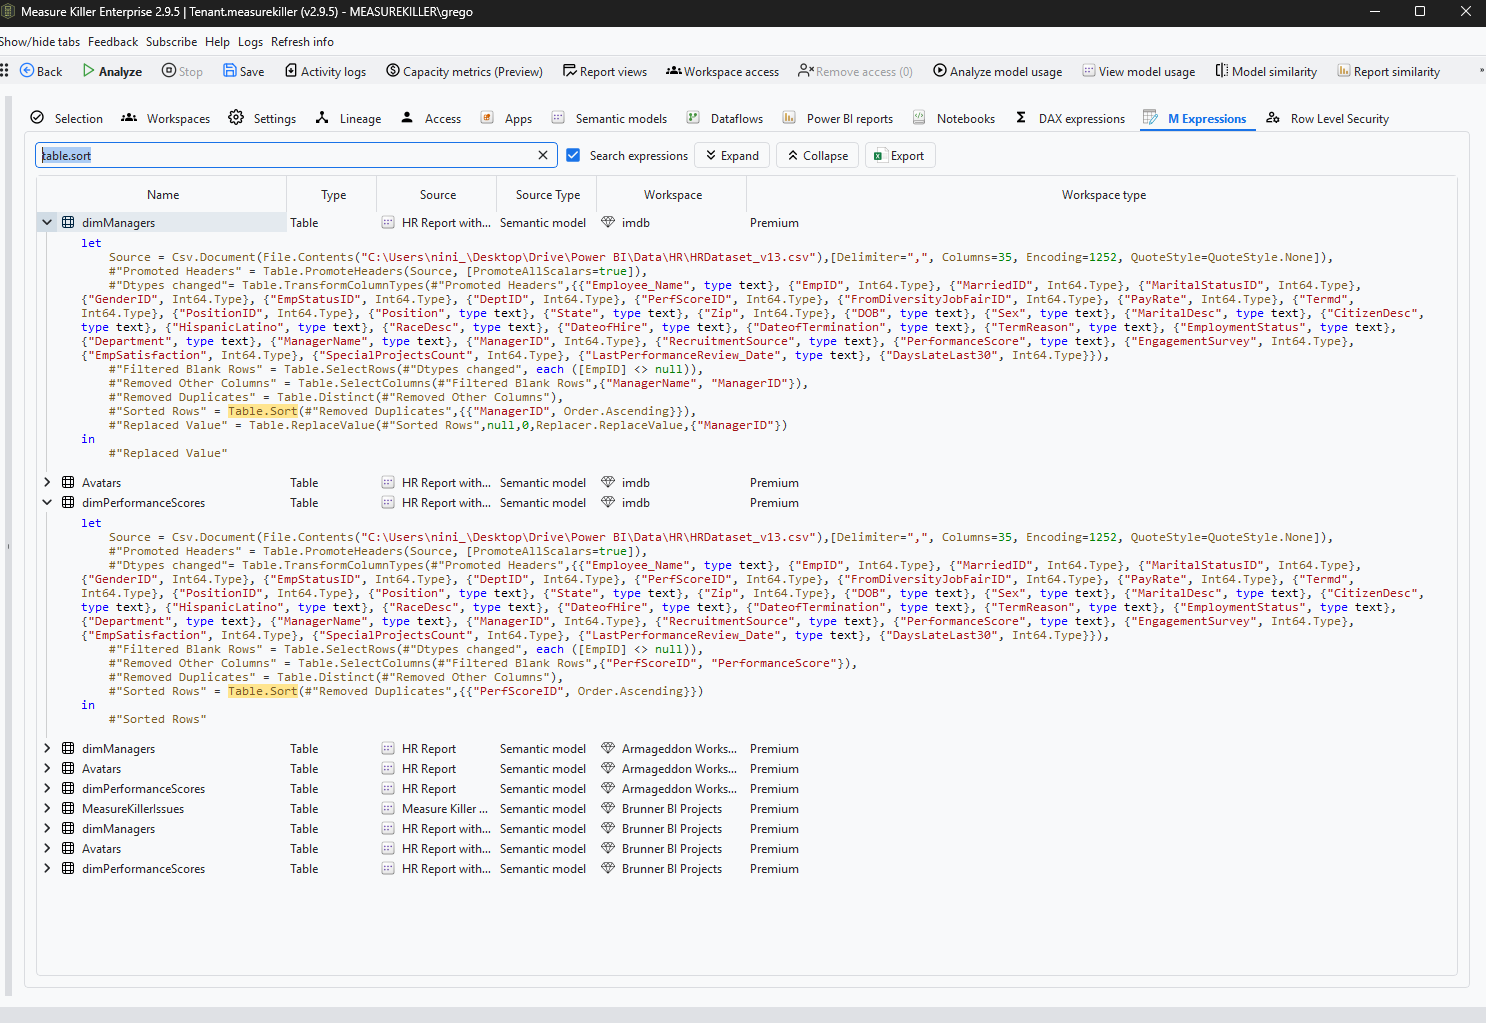
How to find unnecessary sorting in your M code
Sorting a table in Power Query costs us resources on every single refresh and the order is thrown away anyhow when we load the query into Power BI. Here is how to find all needlessly sorted queries across your tenant or workspace.
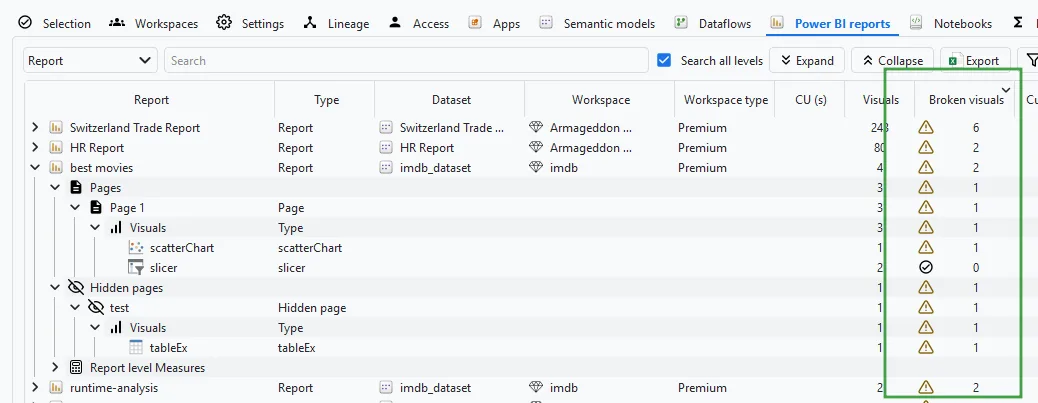
How to find broken visuals in Power BI
Broken visuals show users an error, not data — and nobody tells the owner. Find every one in your tenant, hidden pages included, with the exact reason it broke.
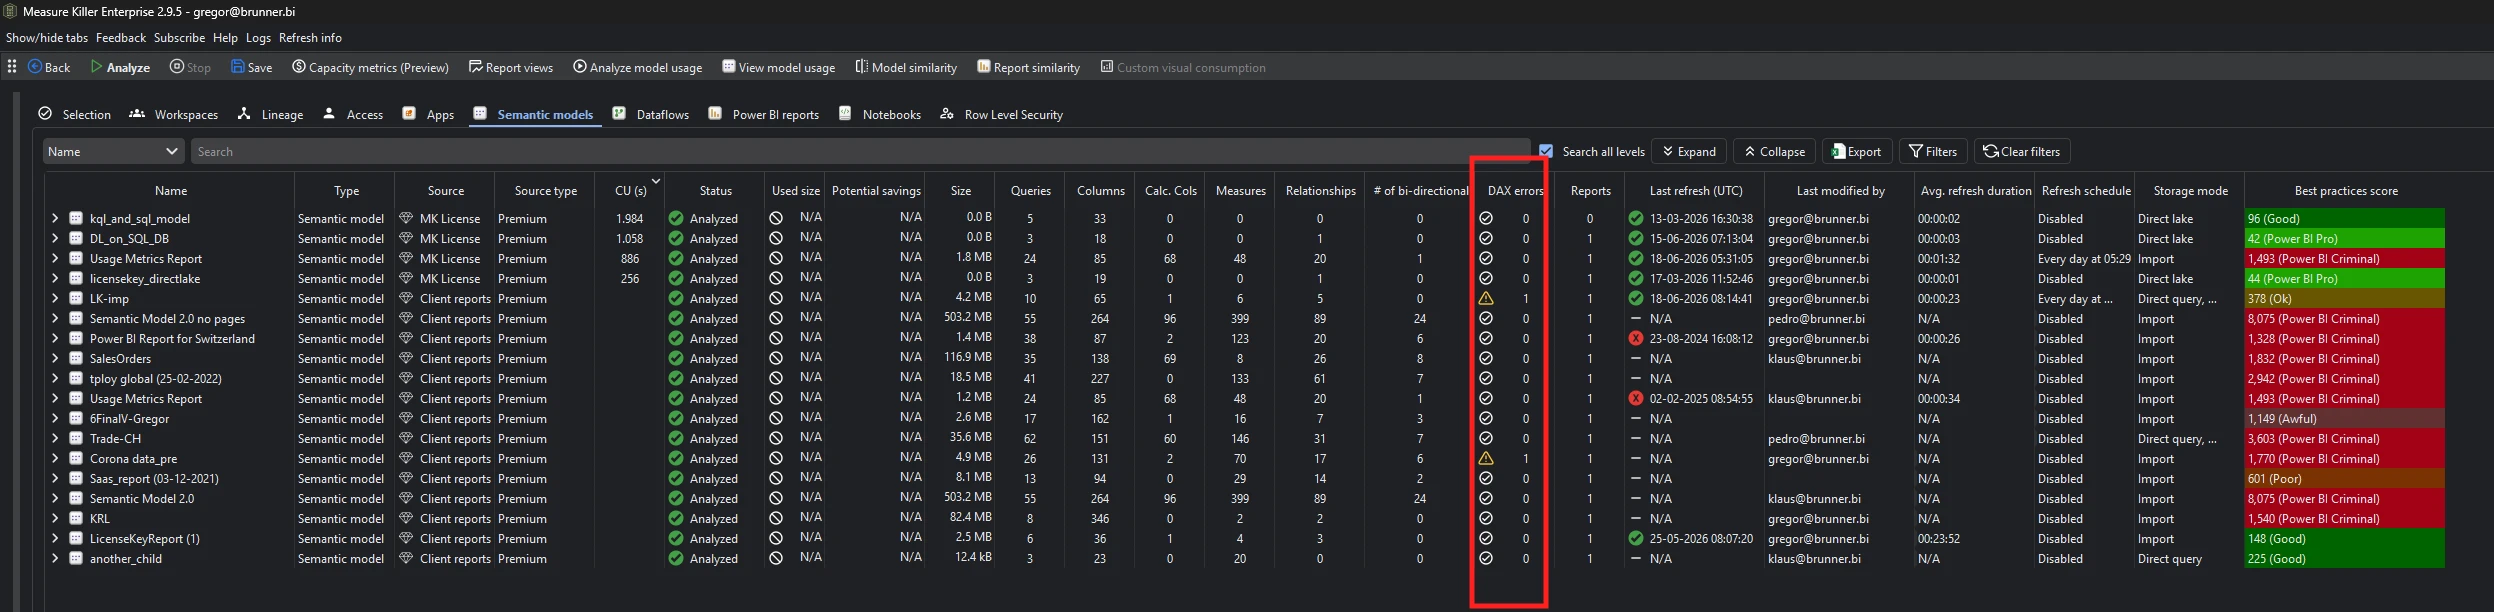
How to find semantic models with broken DAX (measures, columns, tables)
Broken DAX hides — it surfaces as a broken visual or wrong number later. Find every model with failing measures, columns, or tables across your tenant.
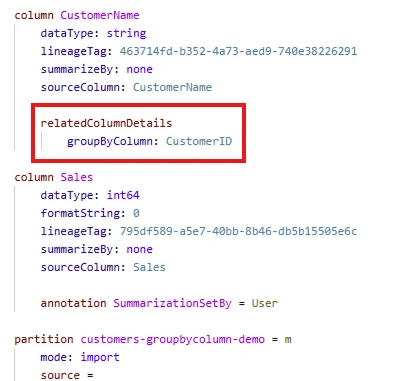
How to set the GroupByColumn property using TMDL view in Power BI
Duplicate customer names get summed into one row in Power BI. GroupByColumn fixes it — the exact TMDL view syntax, including the indentation AI tools get wrong.
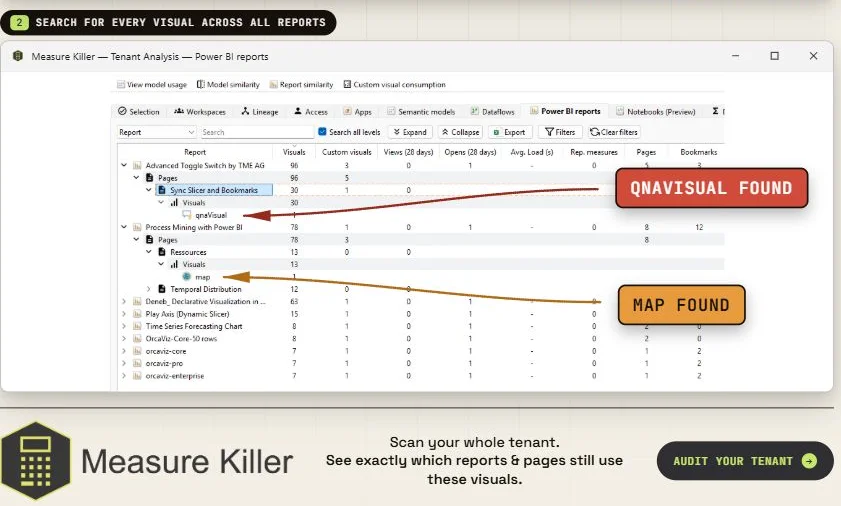
How to find every deprecated Power BI visual in your tenant (Map, Filled Map, Q&A)
Microsoft is deprecating the Map, Filled Map, and Q&A visuals (Q&A breaks in Dec 2026). Here's how to find every affected report across your tenant in time.
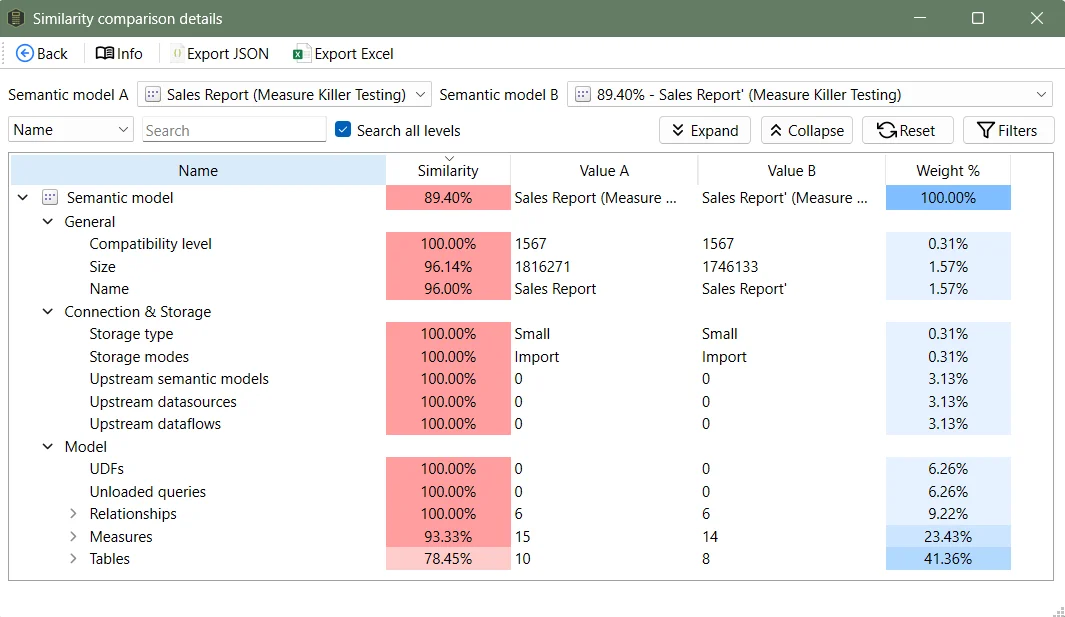
Finding duplicate semantic models in Power BI and Fabric
Side-by-side TMDL diffs break past two models. A similarity score across tables, columns, measures, and relationships finds every near-duplicate model at once.
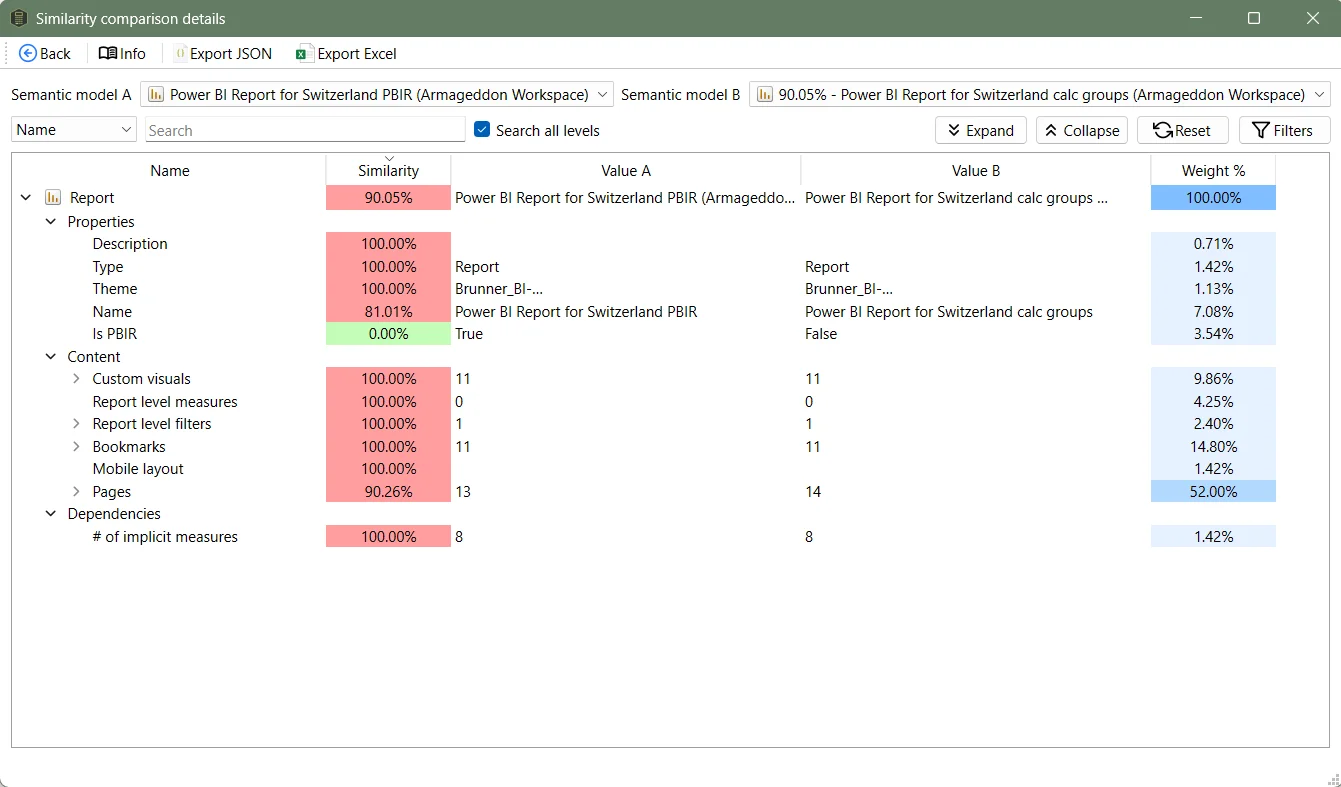
Finding similar or duplicate reports in Power BI and Microsoft Fabric
Report sprawl is classic self-service tech debt. A similarity score across pages, visuals, filters, and bookmarks turns it into something you can clean up.
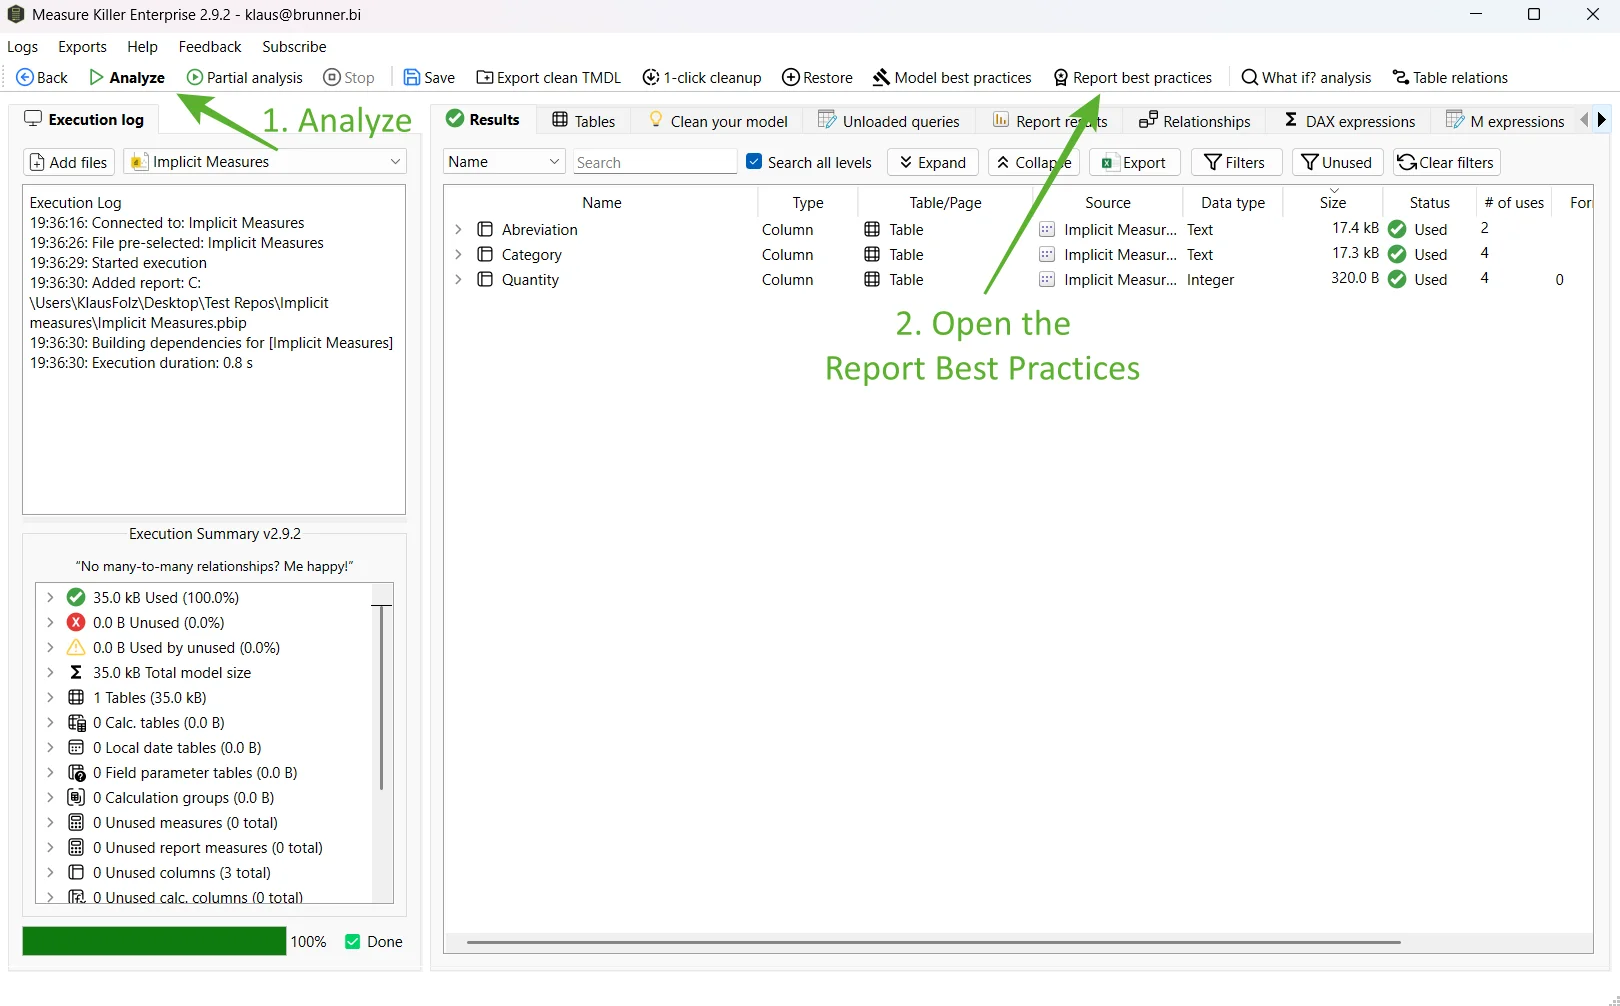
How to identify reports with implicit measures in Power BI
Implicit measures slow you down and break governance. Two ways to find them across your reports - one with a text editor, one with Measure Killer.
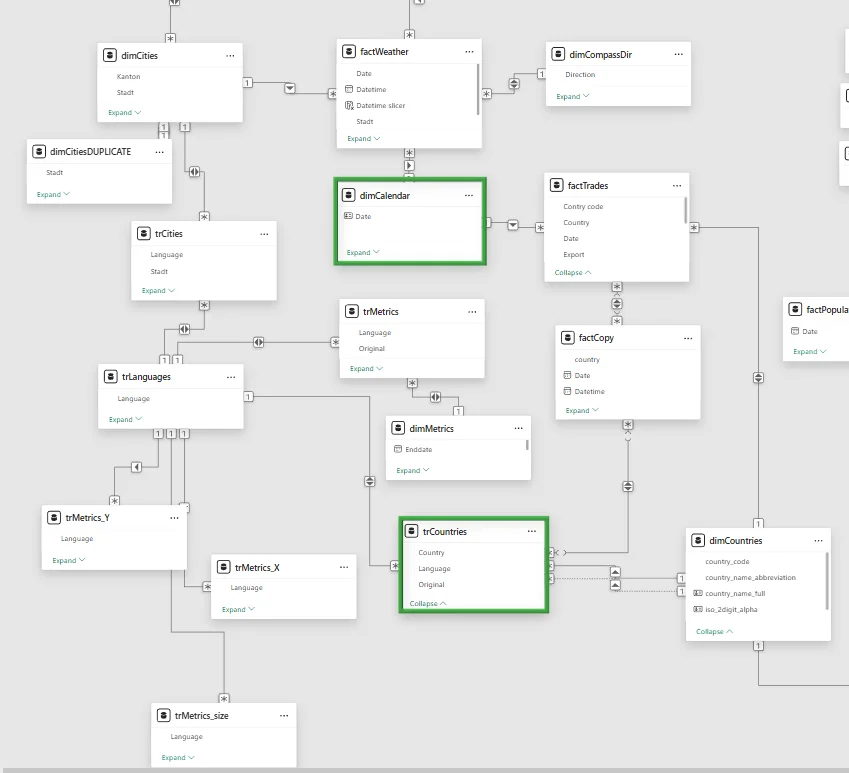
How to find all ways that a table can filter another table in Power BI
Understand filter propagation in complex Power BI models. Measure Killer's Table Relations feature identifies all relationship chains connecting any two tables.