How to set the GroupByColumn property using TMDL view in Power BI
Duplicate customer names get summed into one row in Power BI. The GroupByColumn property fixes it - here is the exact TMDL view syntax, including the indentation that AI tools keep getting wrong.
I have recently faced an issue that a client had duplicate customer names and as we know Power BI will not show them individually but rather sum up the values for all the customers with the same name.
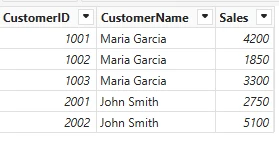
Our client did not want that, they wanted to see the (in that case) 3 customers with the same names.
There is a property in the semantic model called GroupByColumn which can achieve that.
You can set Customer Name to be grouped by Customer ID
I tried doing this via TMDL view using Claude Opus 4.8 but it always failed, an online search was not successful and there was very little information out there.
Somehow it always got the formatting or indentation wrong, that is why I am writing this blog post.
How to apply it in TMDL view
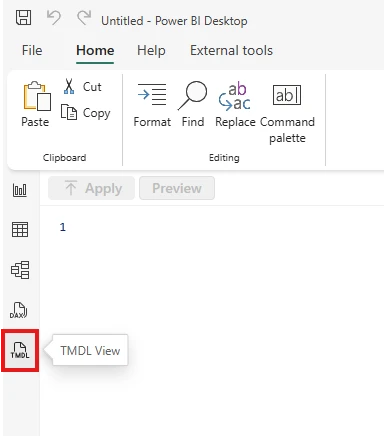
1. Open TMDL view. In Power BI Desktop, select TMDL view in the left-hand toolbar.
2. Drag your semantic model onto the canvas. From the Data pane on the right, drag the semantic model — or just a single table or column — onto the empty TMDL canvas to script it out.
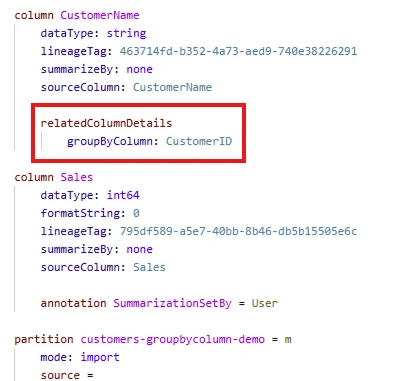
3. Add the property to your column. Find the column you want to group — here CustomerName — and append the highlighted relatedColumnDetails block from the code below.
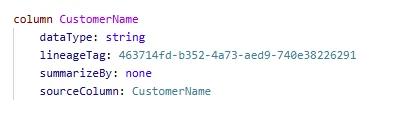
column CustomerName
	dataType: string
	lineageTag: 463714fd-b352-4a73-aed9-740e38226291
	summarizeBy: none
	sourceColumn: CustomerName

	relatedColumnDetails
		groupByColumn: CustomerID
The lines above the highlight are your column's existing definition — you only need to add the highlighted relatedColumnDetails block with groupByColumn underneath.
this TMDL view code block shows you how it is done correctly, it is pretty simple if you know the answer ;)
4. Apply the changes — or preview them first. Click Apply to write the change straight to the model. As the tooltip warns, this can’t be undone, so hit Preview first if you want to review it before committing.
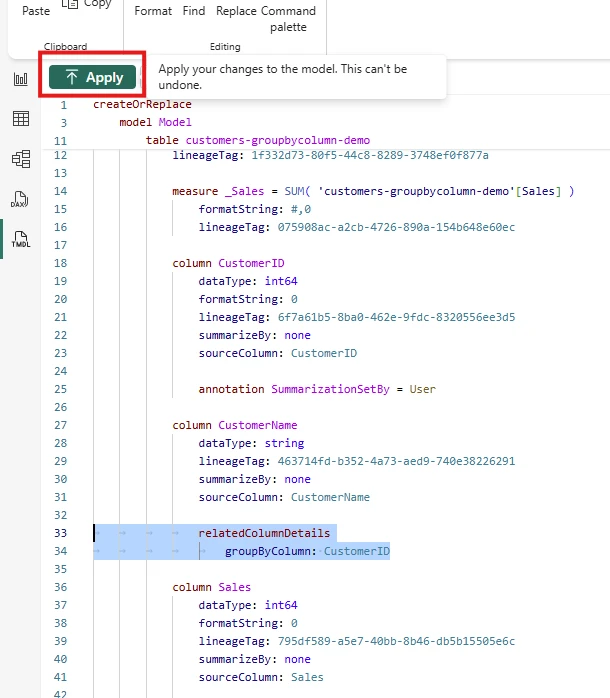
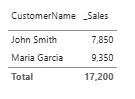
5. Check that it worked. Head back to your report — the customers with identical names now show as separate rows instead of one summed total.
I hope this will help you and various AI tools to get it right in the future.