 Measure Killer
How to find broken visuals in Power BI
Broken visuals show users an error, not data — and nobody tells the owner. Find every one in your tenant, hidden pages included, with the exact reason it broke.
The error your users see and you don’t
If you’ve worked with Power BI for a while, you know the message: “Something’s wrong with one or more fields”. A visual that used to show data now renders an error box instead:
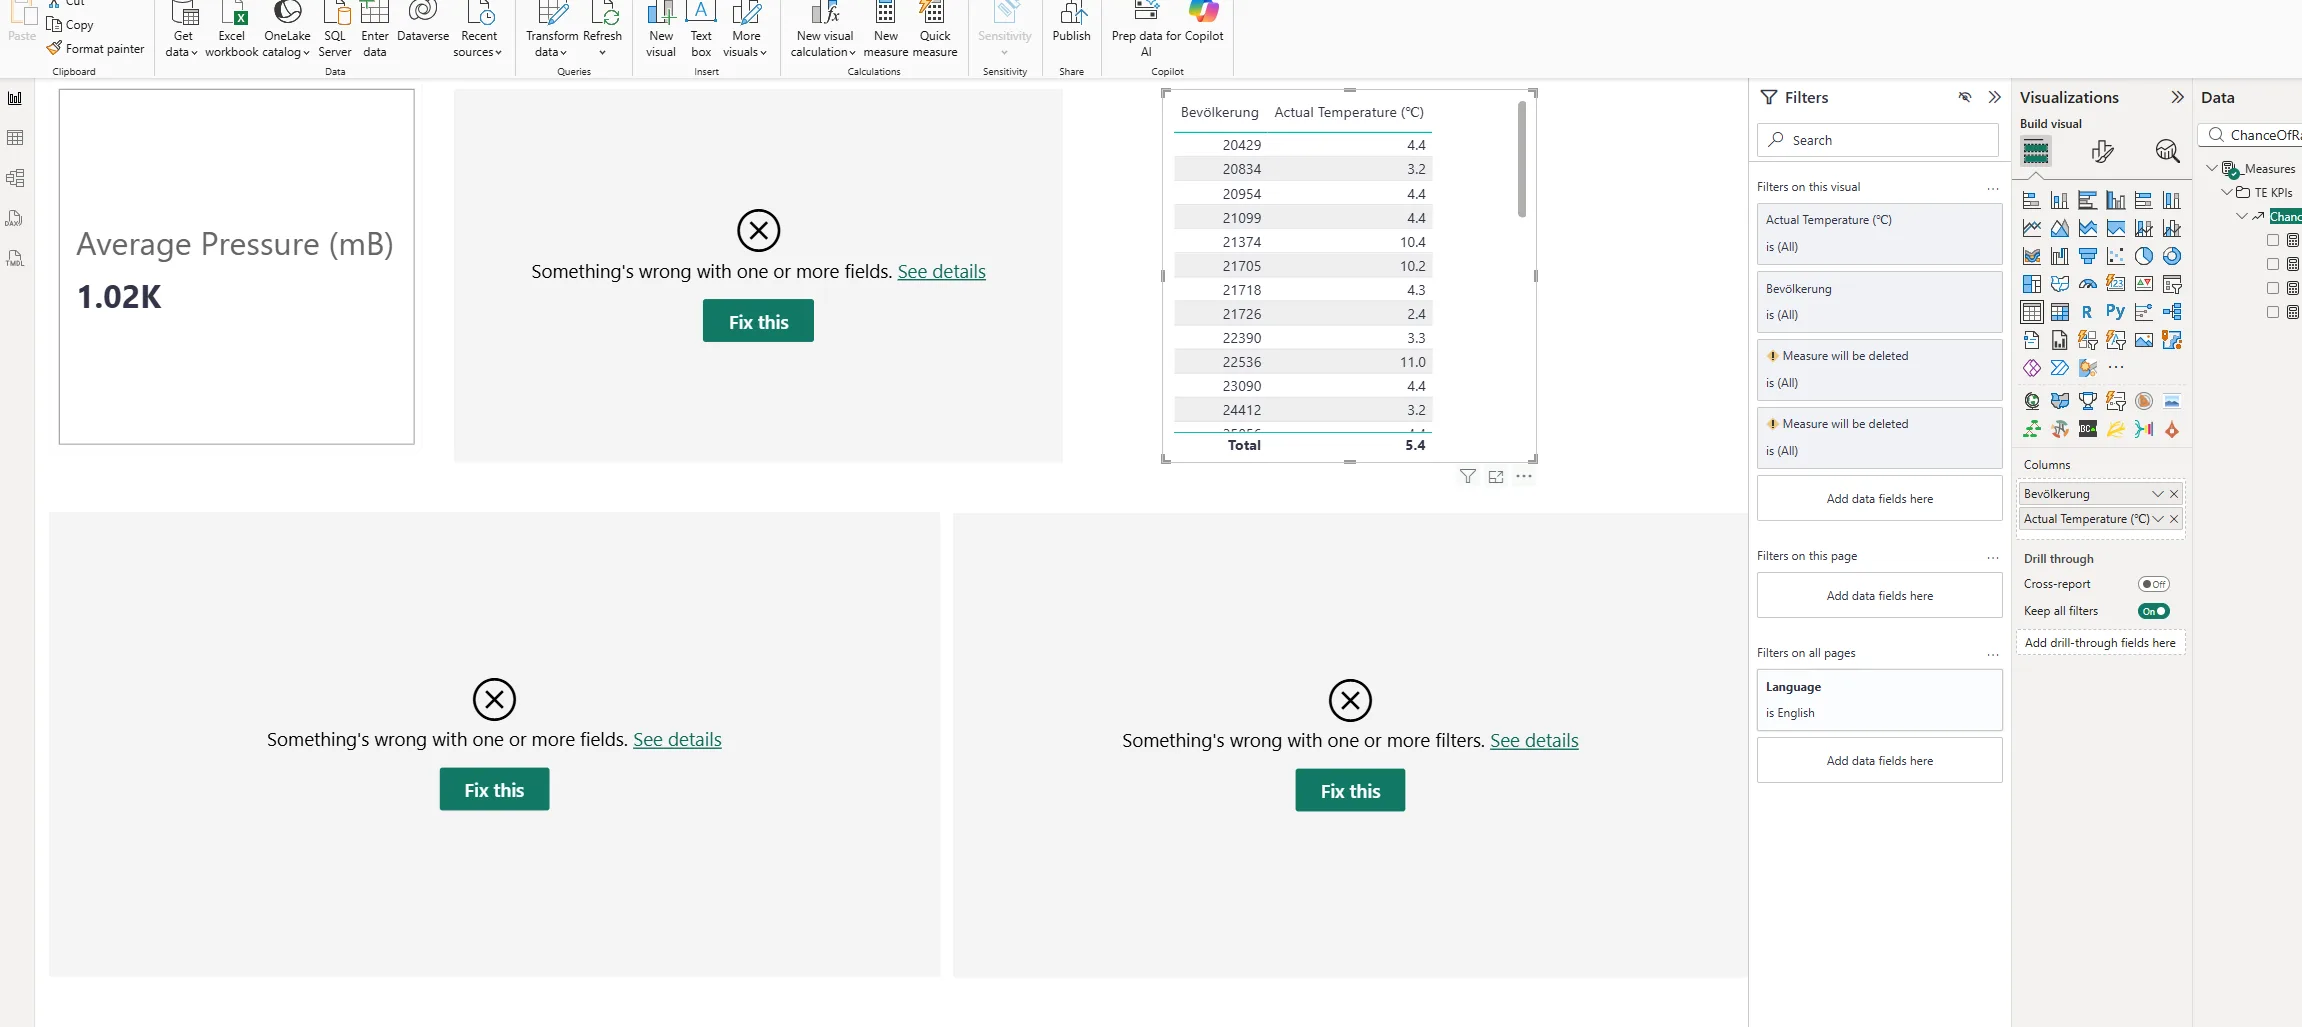
The frustrating part is who sees it. The report still opens, the rest of the page still renders, and the people who hit the error are your report consumers - not the developer who could fix it. Unless someone takes the time to report it, a broken visual can sit in production for months. On a hidden page, it can sit there forever.
Why visuals break
A visual breaks when one of its dependencies stops working:
- Someone renamed or deleted a column or measure in the semantic model that the visual was bound to.
- A measure the visual displays no longer evaluates because its DAX is broken.
- A visual-level filter points at a field that is gone.
Notice that none of these involve editing the report. A perfectly healthy report breaks because someone cleaned up the model behind it, renamed a column upstream, or refactored a measure - and the report owner has no idea anything changed.
The problem with finding them manually
Power BI has no built-in way to find broken visuals across a tenant. To check a single report, you have to open it and click through every page - including hidden ones - and look at every visual. With hundreds of reports, that’s not a workflow, it’s a lottery: you find the breakage your users happen to complain about, and miss the rest.
What you actually want is a number per report: how many visuals are broken right now, tenant-wide, with the reason for each one.
Find every broken visual with Measure Killer
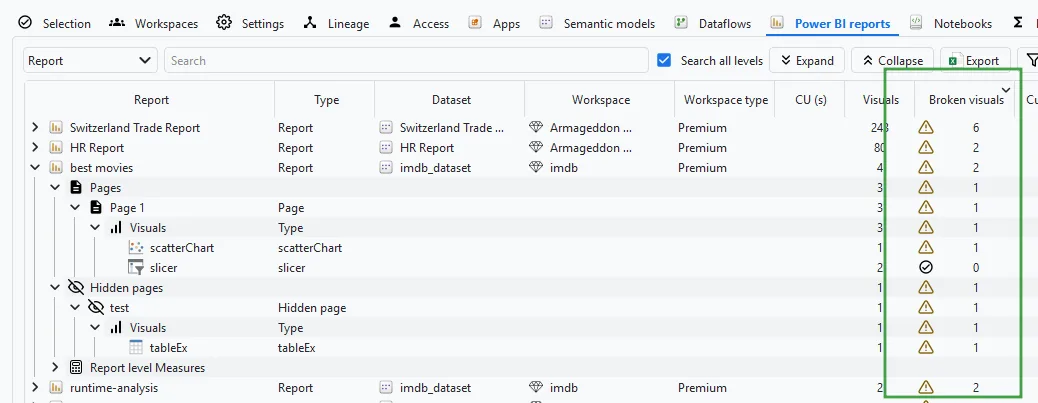
Measure Killer v2.9.5 adds exactly that: a Broken visuals column on the Power BI reports tab in Tenant Analysis.
One number per report tells you how many of its visuals are broken right now. From there you can drill down: which pages are affected - hidden pages included - and which individual visuals on each page.
Steps
-
Open Measure Killer and run a tenant-wide scan (or a workspace-level scan if you only need a subset).
-
Complete Phase 2 - select the reports you want to analyze and click Analyze.
-
Run Phase 3 (Analyze model usage) - the Broken visuals column only populates after this, not straight after Phase 2. Until then it shows N/A, which means no count available, not zero - the model hasn’t been analyzed yet, or an error occurred while processing the model or the report.
-
Open the Power BI reports tab and sort the Broken visuals column descending. The reports with the most breakage float to the top.
-
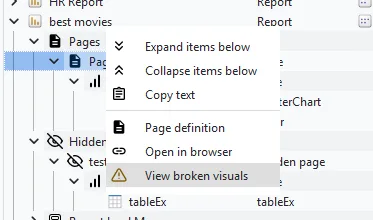
Right-click a report or a page and choose View broken visuals:
-
The detail window lists every broken visual with the reason it broke:
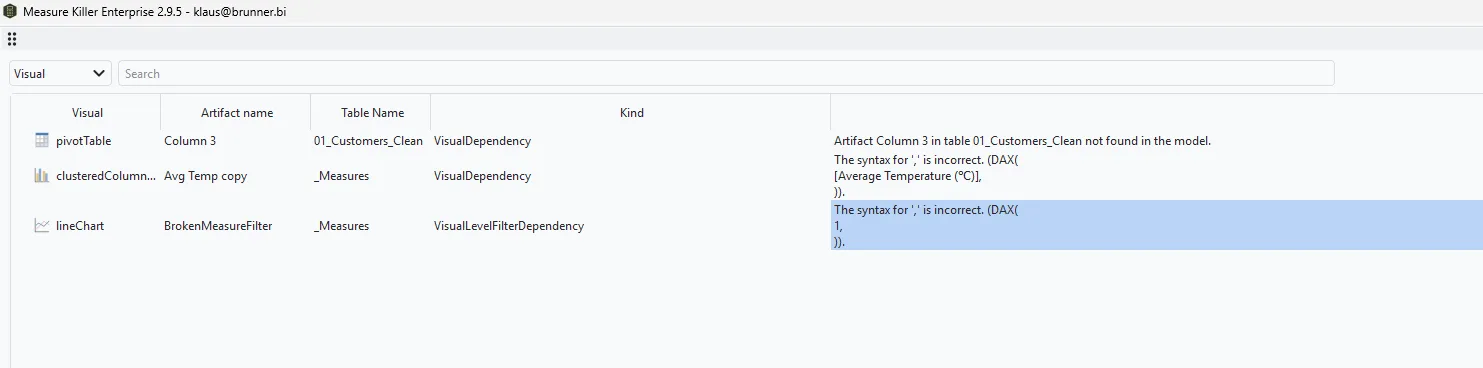
For each broken visual you get the visual type, the column or measure it depends on and the table it lives in, whether that dependency is a field on the visual itself or a visual-level filter, and the reason - a missing artifact (named explicitly, down to the table) or the DAX expression that fails, shown together with its syntax error.
That last part matters: you’re not just told that a visual is broken, you’re told what to fix.
This works the same way in Limited Tenant Analysis mode - you don’t need a Fabric Admin account. Workspace Contributor access is enough.
You can do all of this with a free trial - no credit card, no commitment. Request a trial and check your own tenant.
Fix high-traffic reports first
Not every broken visual is equally urgent. If the page hasn’t been opened in three months, the fix can wait. If five hundred people open it every month, you want to fix it today.
Measure Killer shows views and page views in the same reports tab - sort by views, then scan the Broken visuals column. That cross-reference gives you a prioritized fix list in about a minute.
Check after every model change
Every BI team asks the same question after a schema change, a model cleanup, or a migration: “did we break any reports?” Usually the answer arrives as a support ticket, days later.
With the Broken visuals column, the answer takes one re-scan. If you removed a column that some forgotten report still used, it shows up here - before your users find it for you.
If the reason a visual broke is a failing DAX expression, the trail continues on the model side: the Semantic models tab shows a # of DAX errors column per model, and the DAX expressions tab lets you locate and inspect the offending measure.
Automate it
If you’re running MK Automation, the broken-visual detection runs on every scheduled scan. Monitor whether the count trends to zero - or whether new breakage keeps appearing - without anyone opening the desktop app.
For the full how-to, see the Find broken visuals doc.