 Measure Killer
How to identify reports with implicit measures in Power BI
Implicit measures slow you down and break governance. Two ways to find them across your reports - one with a text editor, one with Measure Killer.
What is an implicit measure?
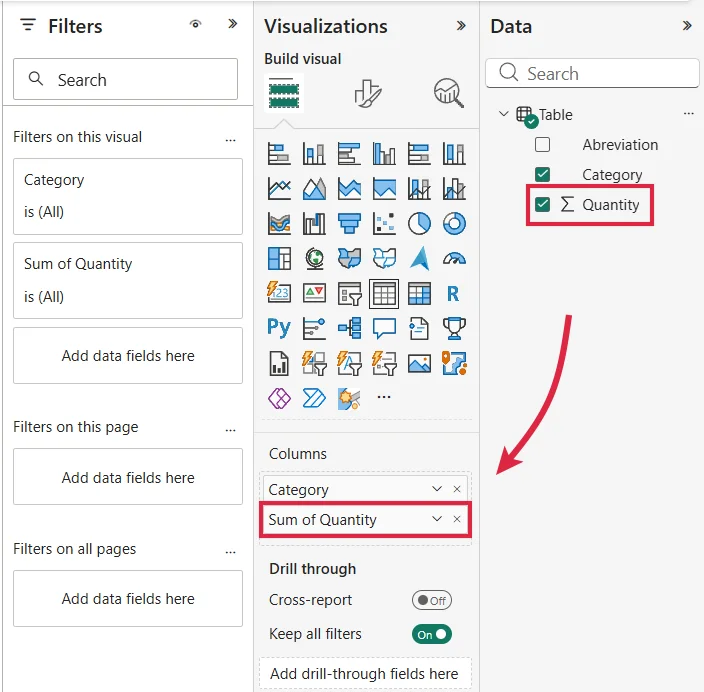
When you drag a numeric column directly onto a Power BI visual, Power BI silently creates an aggregation behind the scenes - a sum, average, min, max, or count that lives inside the visual definition rather than in your model. That hidden aggregation is an implicit measure.
It looks convenient. It is the wrong default for any report you intend to keep.
Why implicit measures are a problem
Implicit measures bypass everything that makes a Power BI model maintainable. They cannot be reused across visuals, they ignore your formatting and folder structure, they break composite-model scenarios, and they make Calculation Groups behave unpredictably. When you switch a model into Direct Lake, implicit measures are not supported at all - every visual using one stops working.
The cost is silent and cumulative. One implicit measure is a typo. A thousand across a tenant is a migration that gets postponed for a quarter.
Method 1 - Search the PBIR file with a text editor
Power BI Desktop now supports the new PBIR project format (still in preview). When
you save a report as PBIR, every visual definition becomes a JSON file you can
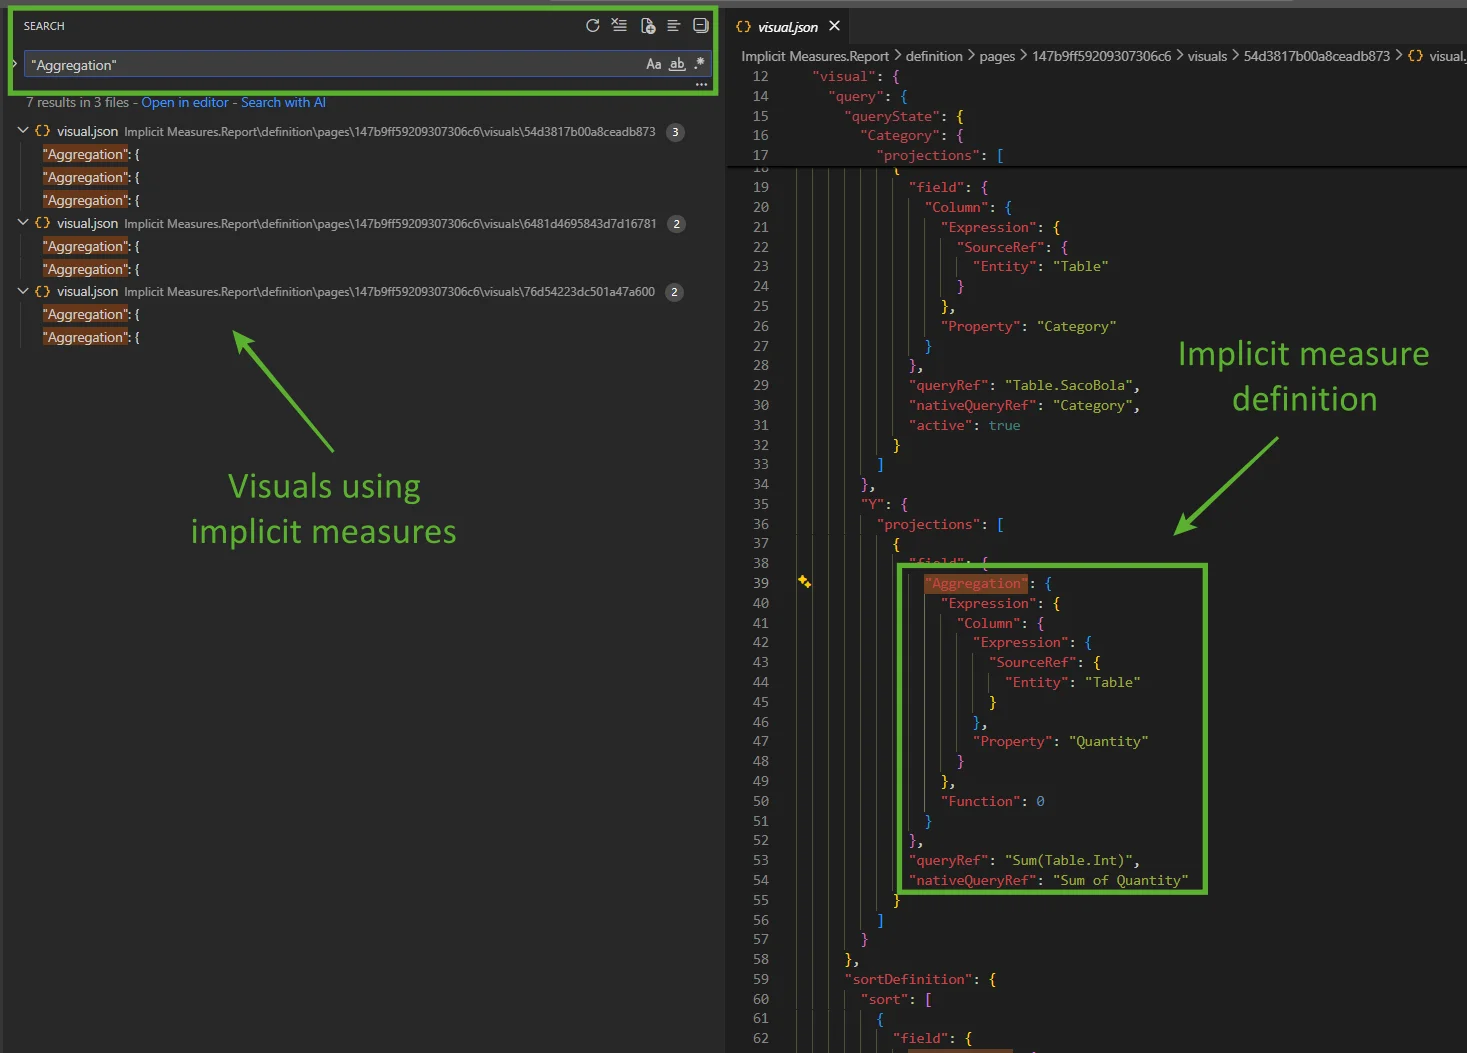
read. Implicit measures show up under an Aggregation property.
Steps:
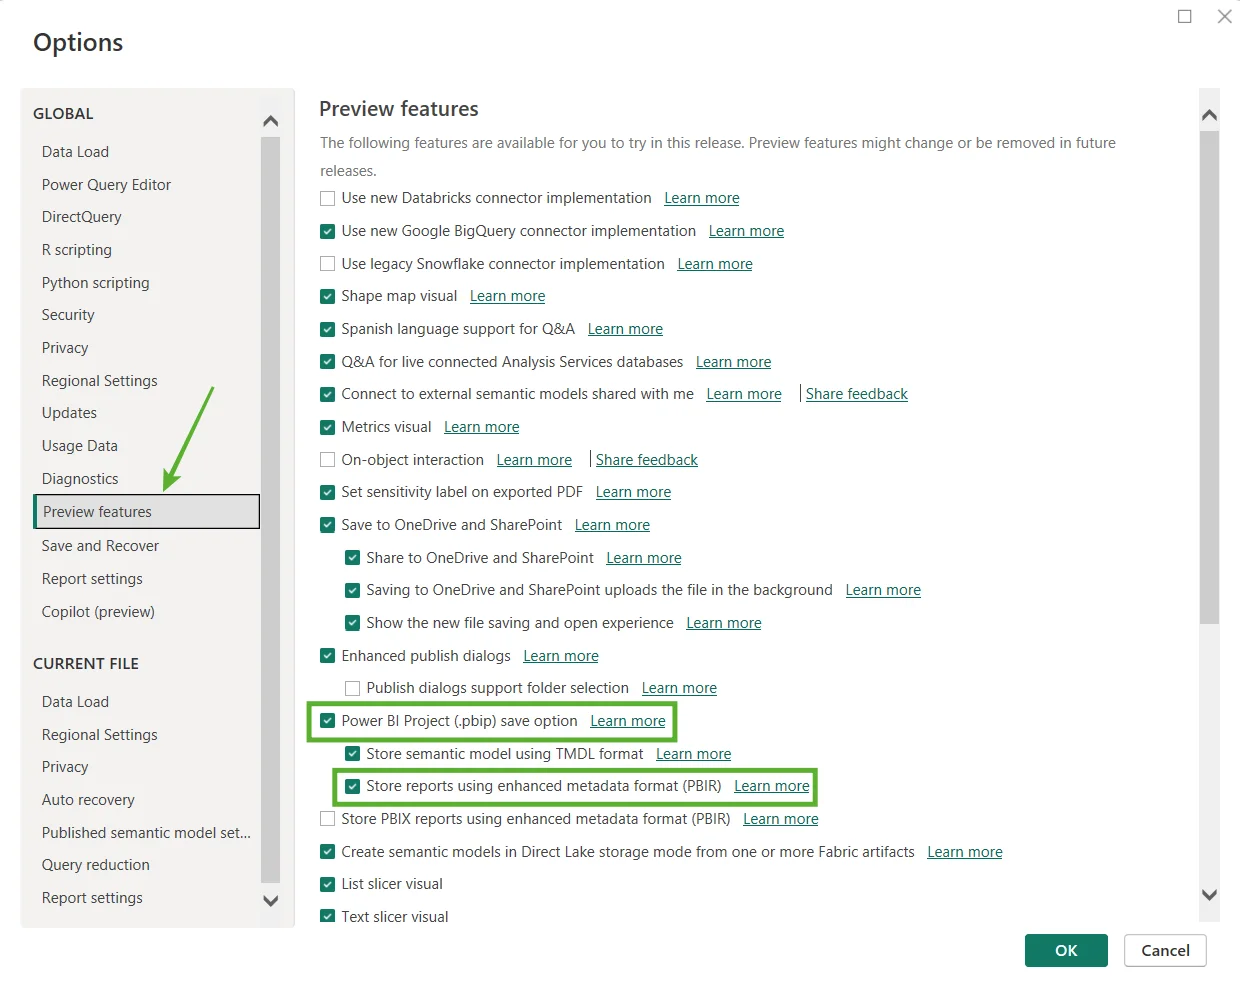
- In Power BI Desktop, enable the PBIP and PBIR (preview) options under File → Options → Preview features.
- Save your report as a PBIR project to a folder.
- Open that folder in VS Code (or any editor with project-wide search).
- Search across all files for the string
Aggregation.
Pros. Free. No tools to install. Works on any single report you have local access to.
Cons. Manual, one report at a time. PBIR is still preview, so not every report will be in this format. You’re searching raw JSON, so you’ll need to map each hit back to a visual by hand. Doesn’t scale beyond a handful of reports.
Method 2 - Detect them automatically with Measure Killer
The free desktop edition of Measure Killer scans a .pbix file and lists every
implicit measure in one place - which visual, which page, which column.
Steps:
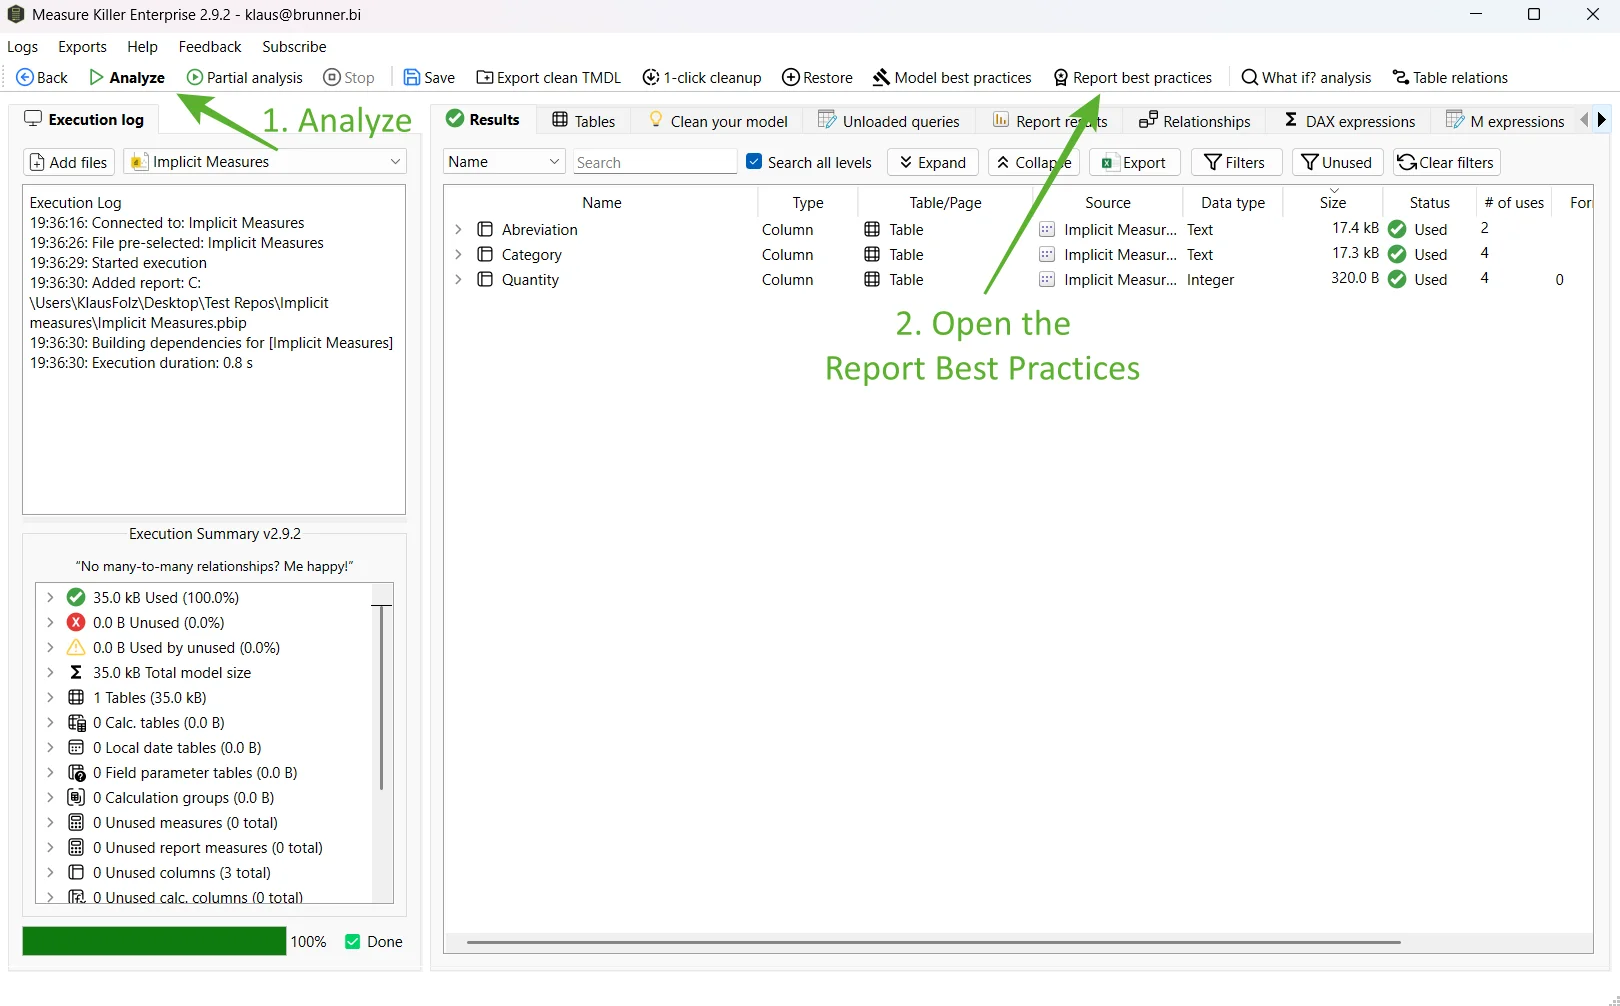
- Open Measure Killer and connect it to your
.pbixfile. - Click Analyze to scan the model.
- Open the Report Best Practices view.
- Expand the Implicit measures rule for a flat list of every offender.
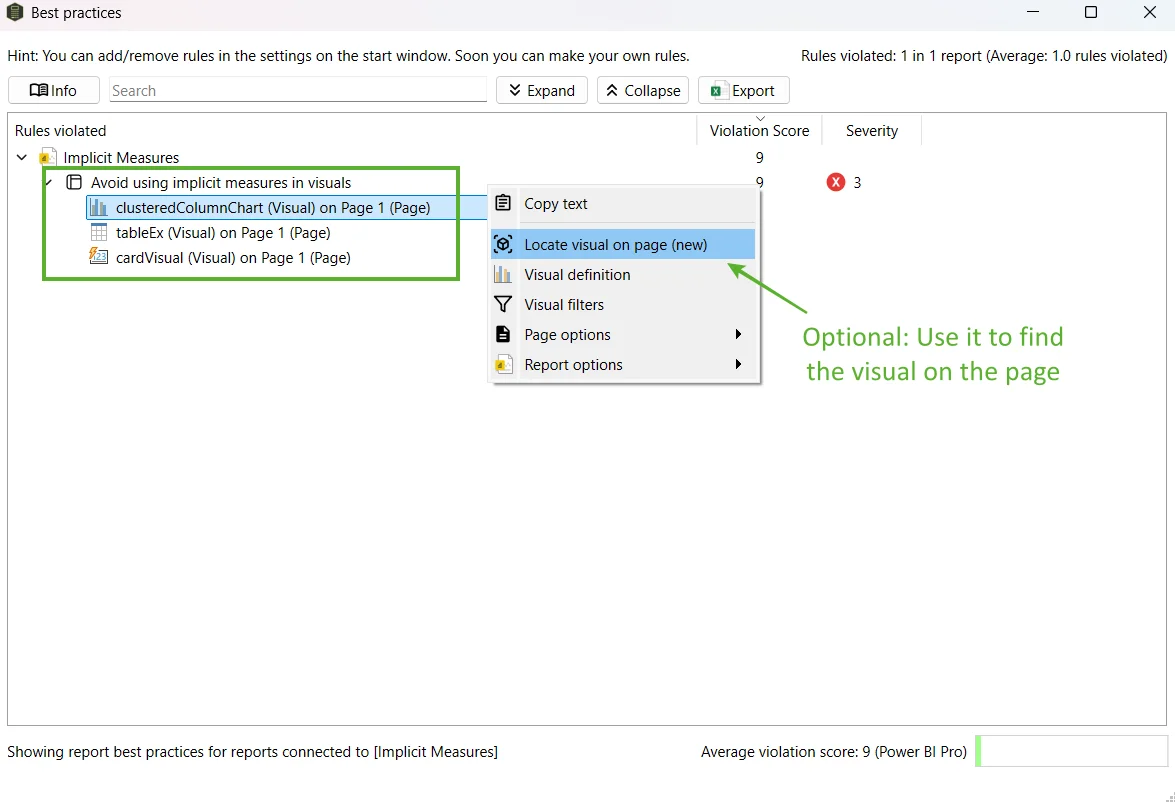
Pros. Works on any .pbix, no preview features required. Scales - point it at
a folder of reports or, with the paid edition, at an entire tenant. Findings come
with the context you need to fix them (column reference, visual, page).
Cons. Requires installing Measure Killer. The desktop edition is free but you still have to download it.
Which method should you use?
If you’re auditing one report and want to stay in your editor, the PBIR method is fine. If you’re cleaning up a workspace, a tenant, or you do this work more than once a quarter, the manual approach gets old fast - that is exactly the problem Measure Killer was built for.
Either way, the goal is the same: get implicit measures out of the report layer and into proper, reusable model measures. Your future self, your colleagues, and your Direct Lake migration will all thank you.
Originally published on the Brunner BI blog.