How to find every deprecated Power BI visual in your tenant (Map, Filled Map, Q&A)
Microsoft is deprecating the Map, Filled Map, and Q&A visuals (Q&A breaks in Dec 2026). Here's how to find every affected report across your tenant in time.
Three standard visuals are going away
Microsoft has announced the deprecation of three built-in Power BI visuals:
- Map (
map) - Filled Map (
filledMap) - Q&A (
qnaVisual) - deprecation announcement
The map visuals will be automatically replaced by Azure Maps. That sounds painless - until a report’s conditional formatting, drill-through, or layout breaks because Azure Maps doesn’t handle a specific configuration the same way. You’ll want to verify every affected report, not assume the migration was clean.
The Q&A visual is worse. There is no automatic replacement. In December 2026, the Q&A visual will simply stop rendering. Every report that uses it will have a broken visual - a blank space where the Q&A box used to be. If nobody notices until users report it, you’re already behind.
The question is the same in both cases: which reports in my tenant still use these visuals?
The problem with finding them manually
Power BI has no built-in way to search for a specific visual type across reports. You can open a report, click through every page, and check every visual - but that’s one report at a time. A tenant with hundreds of reports makes this impractical.
You could export reports as PBIR and grep through the JSON, but that requires preview features, local copies of every report, and manually mapping file paths back to visual names and pages.
What you actually want is a flat list: every instance of map, filledMap, or qnaVisual across your entire tenant, with the report name and page it sits on.
Find every instance with Measure Killer
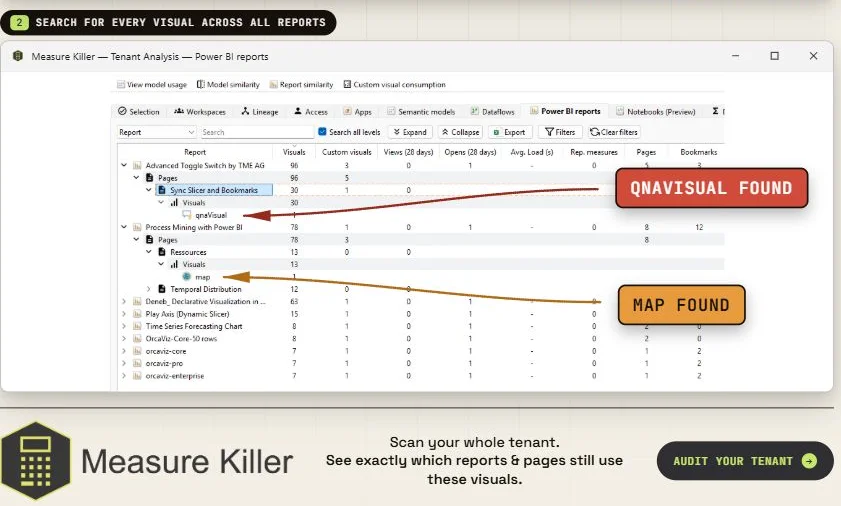
The Power BI reports tab in Tenant Analysis gives you exactly that list. After a tenant scan, it shows every report with its pages and visuals - and you can search and filter by visual type across all scanned reports.
Steps
- Open Measure Killer and run a tenant-wide scan (or a workspace-level scan if you only need a subset).
- Complete Phase 2 - select the reports you want to search and click Analyze.
- Open the Power BI reports tab.
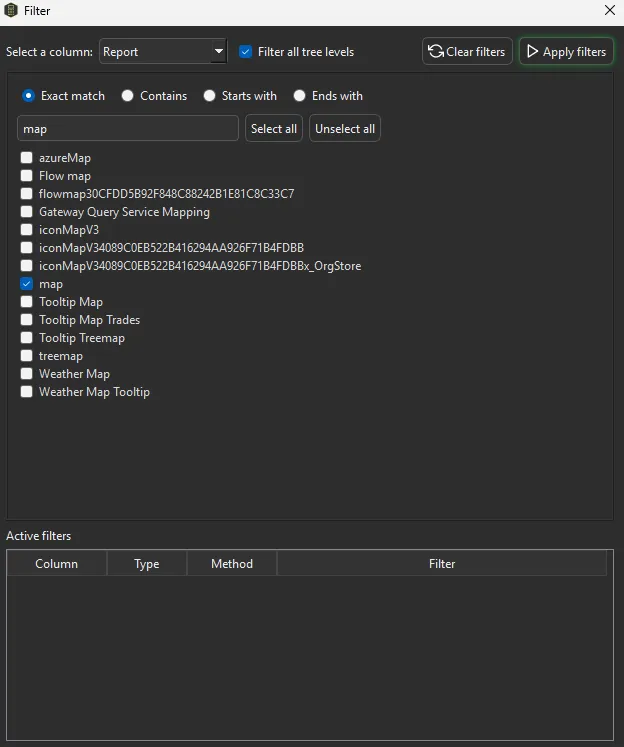
- Use the search bar to find the visual type you’re looking for, or click the Filters button and use Exact match to search for
map,filledMap, orqnaVisual.
The standard search bar would also match visuals that merely contain the text (e.g. searching for “map” would include azureMap, treemap, iconMapV3, and others). The Filters dialog lets you do a case-sensitive, exact-match search so you only get the visuals you are actually looking for.
Every matching visual appears in the list with its report and page. You now have the complete inventory of affected reports.
This works the same way in Limited Tenant Analysis mode - you don’t need a Fabric Admin account. Workspace Contributor access is enough.
You can do all of this with a free trial - no credit card, no commitment. Request a trial and run the search against your own tenant.
What to do with the list
For map and filled map visuals: open each affected report in Power BI Desktop and confirm the Azure Maps replacement renders correctly. Pay attention to:
- Conditional formatting rules - colors and thresholds may not carry over
- Drill-through actions - test that they still navigate correctly
- Layout and sizing - Azure Maps may render at a slightly different aspect ratio
- Custom tooltips - verify tooltip fields still appear
For Q&A visuals: there is no replacement. For each report on the list, decide whether to:
- Replace the Q&A visual with a different visual type that serves the same purpose
- Remove the visual entirely if it’s not actively used (check report views & opens to see if anyone actually opens the page it’s on)
- Communicate the change to users before December 2026
Prioritize by usage
Not every affected report needs the same urgency. Cross-reference your visual search with report views & opens to see which reports actually get traffic. A Q&A visual on a report with zero views in the last three months can wait. A Q&A visual on a report viewed 500 times a week cannot.
Automate it
If you’re running MK Automation, the same visual inventory is produced on every scheduled scan. Set up a recurring scan and monitor whether the deprecated visual count is trending to zero - or whether new reports with deprecated visuals keep appearing.
This works for any visual type
The deprecated map and Q&A visuals are today’s problem, but the workflow applies to any visual type. The next time Microsoft deprecates a visual, or your organization decides to standardize on specific visual types, the same search gives you the complete inventory in minutes.
For the full how-to - including design-standards enforcement and post-migration validation - see the Find visual types doc.
If your concern extends to custom (non-Microsoft) visuals - certification status, license compliance, or uncertified visuals that could send data externally - see Custom visual consumption.
See also: the video walkthrough of this workflow.