How to find all ways that a table can filter another table in Power BI
Understand filter propagation in complex Power BI models. Measure Killer's Table Relations feature identifies all relationship chains connecting any two tables.
The problem
Verifying report accuracy requires understanding the filter context. While straightforward in clean star or snowflake schema models, messy models with many-to-many relationships, bi-directional cross filters, and auto-detected relationships make this extremely difficult.
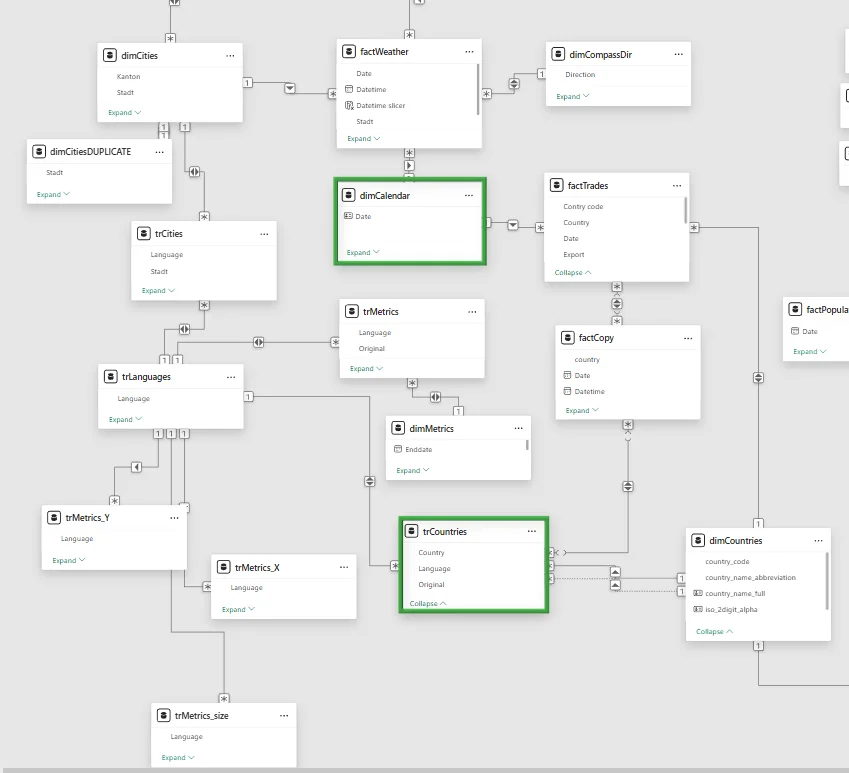
Consider determining how a slicer using dimCalendar table columns
influences visuals employing trCountries table columns. This involves
tracing how calendar filters propagate through the model to affect DAX
evaluation. In poorly designed models, this manual investigation
becomes extremely labor-intensive.
The solution: Table Relations in Measure Killer
Measure Killer’s Table Relations feature identifies all possible relationship chains connecting any two tables and shows how filter propagation works through each path. The feature is available in the free version for local single-model analysis.
How to use it
- Run an analysis in Measure Killer (any mode).
- Click the Table Relations button in the toolbar.
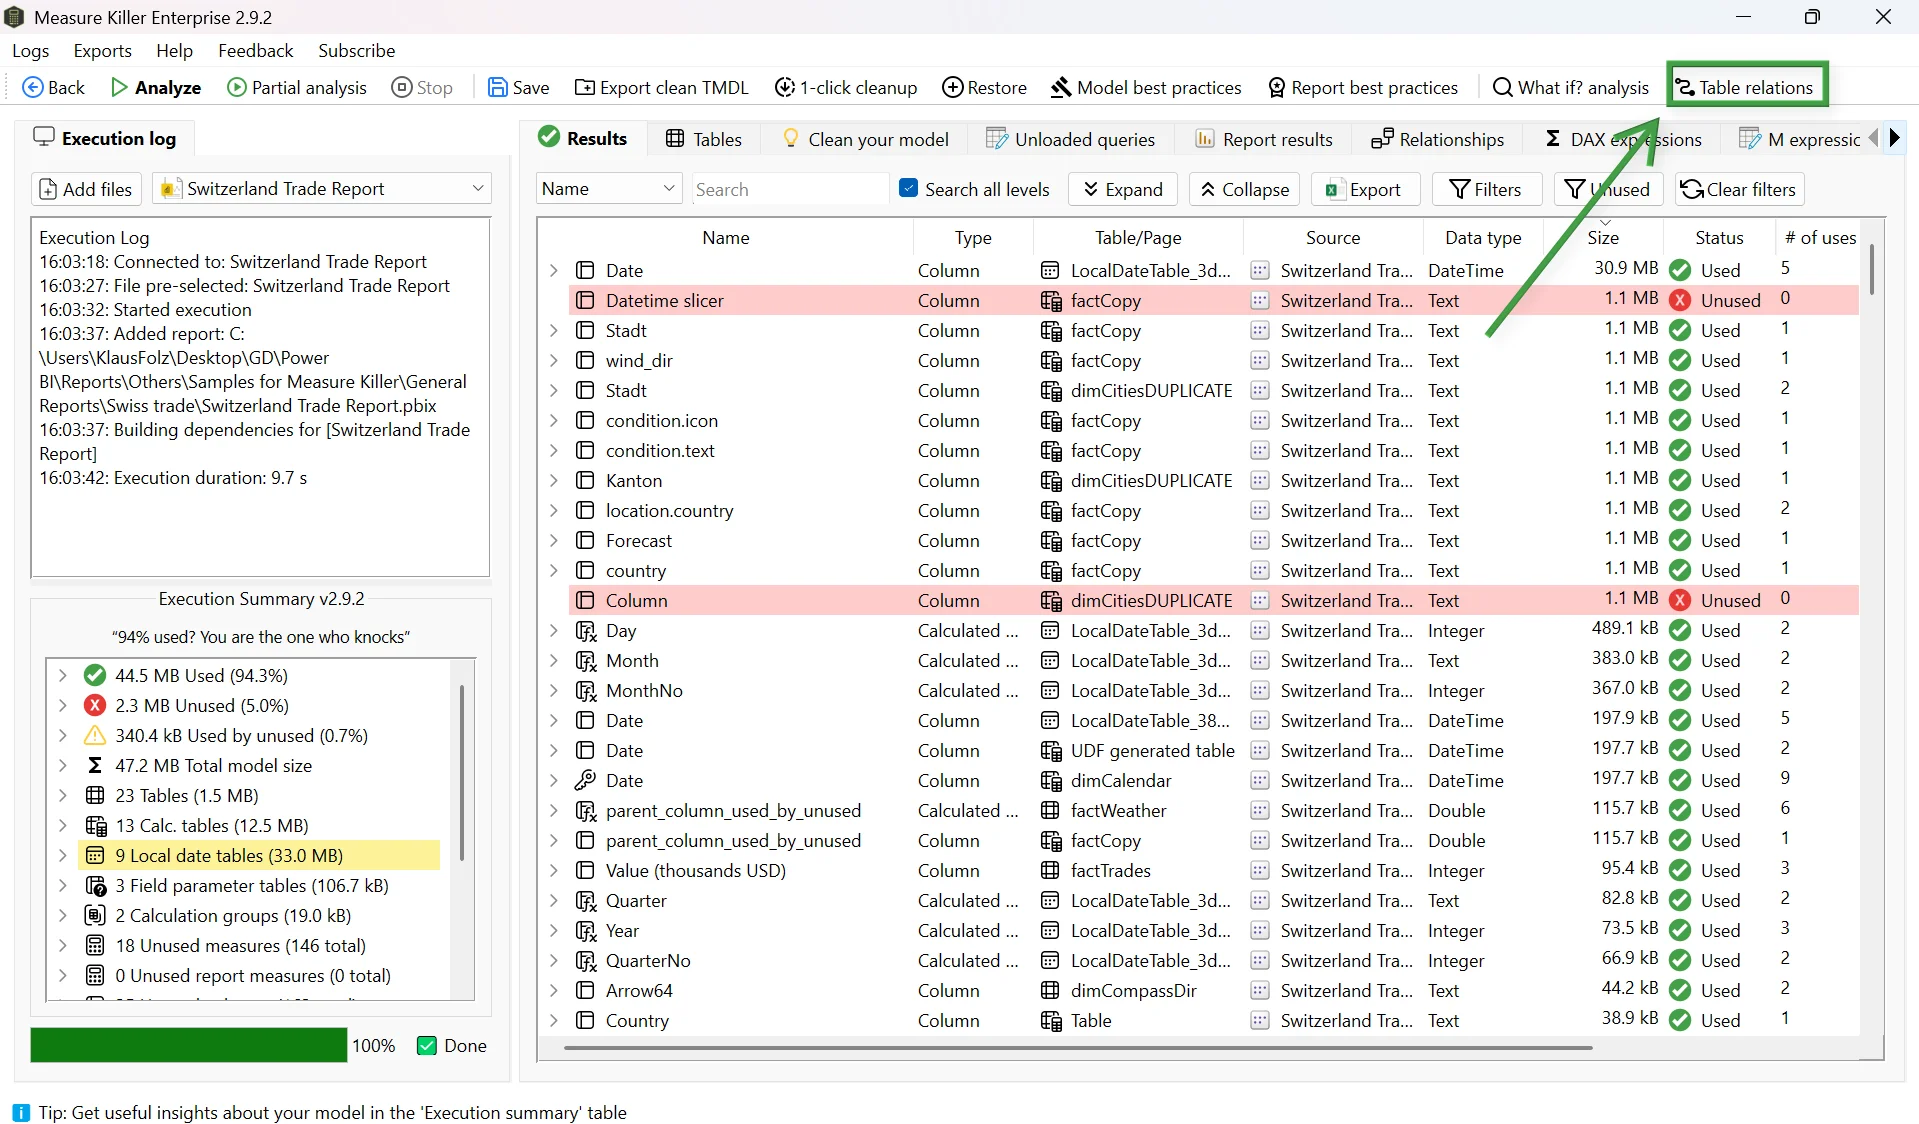
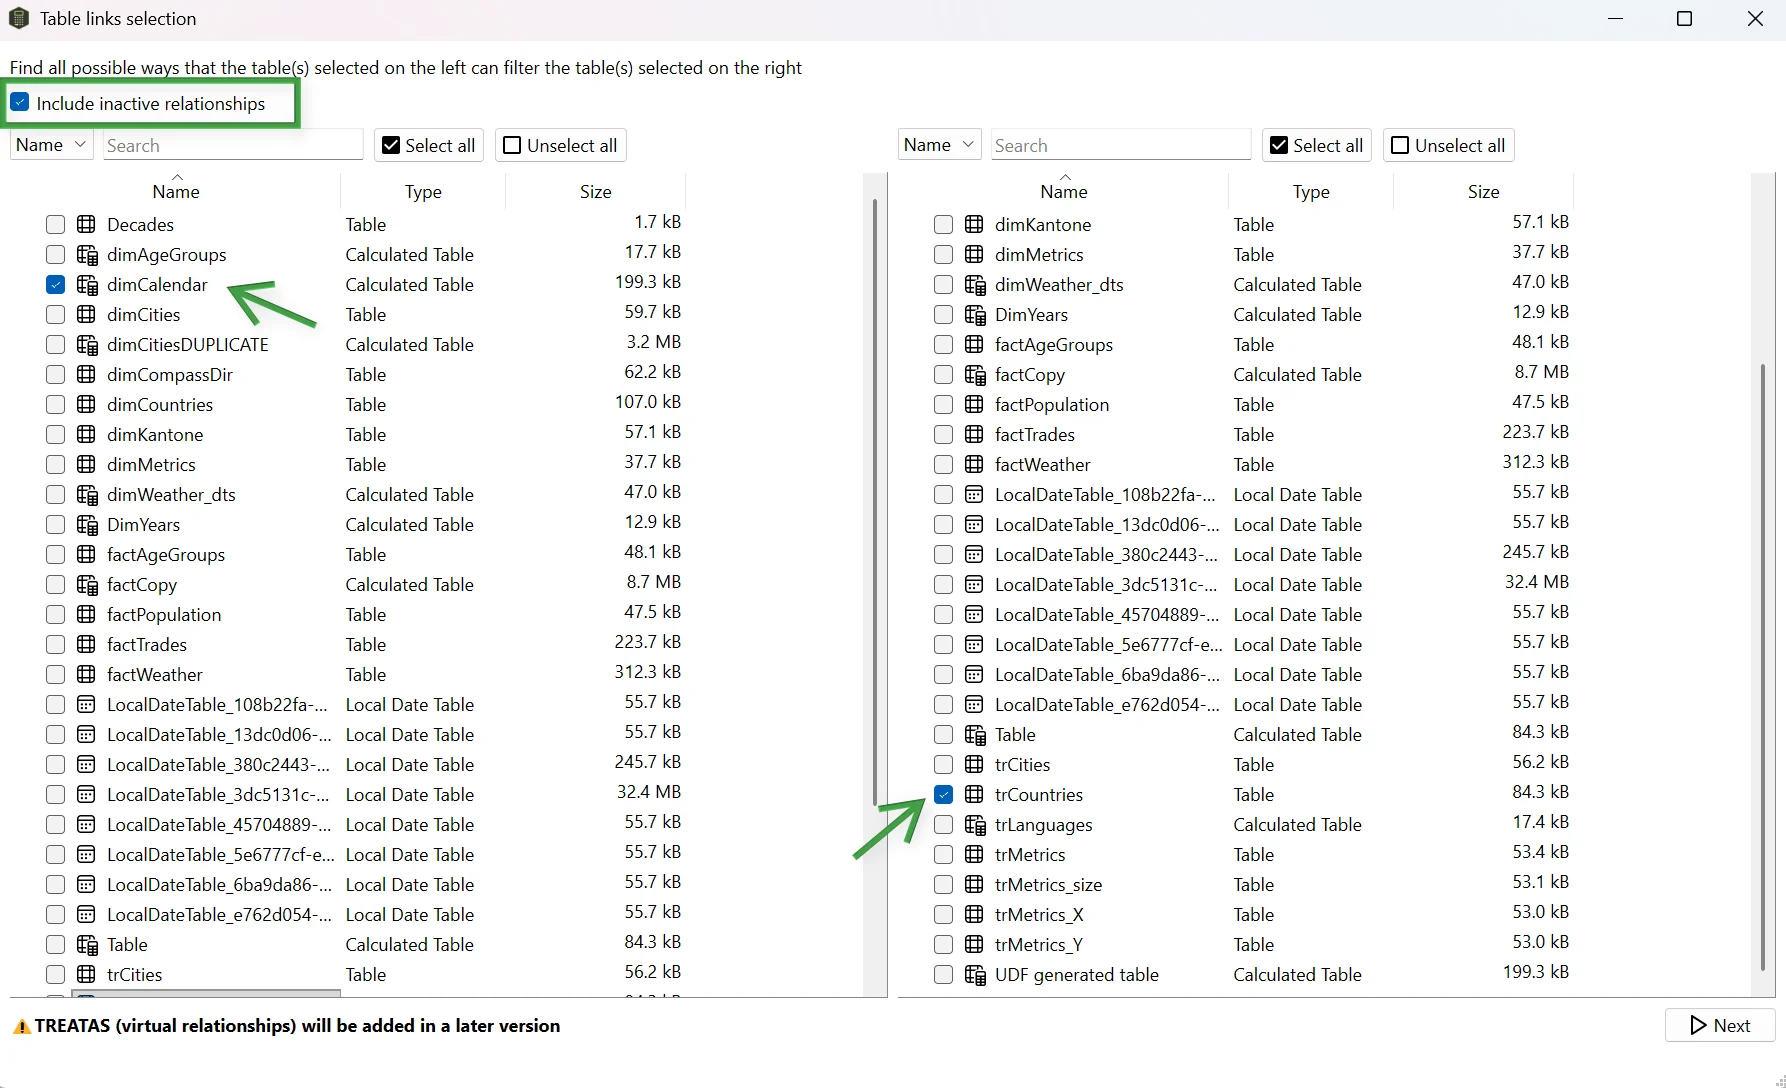
- Select the source table on the left (e.g.
dimCalendar) and the target table on the right (e.g.trCountries).
The direction matters - the left-side selection is “how can this table filter the right-side table.” Results vary based on relationship cross-filter directions and cardinality.
Options
- Include inactive relationships - check the top-left option to
see paths that go through inactive relationships. Useful for
understanding what
USERELATIONSHIPcan activate. - Multi-select - select multiple tables simultaneously for a comprehensive overview of filter paths across the model.
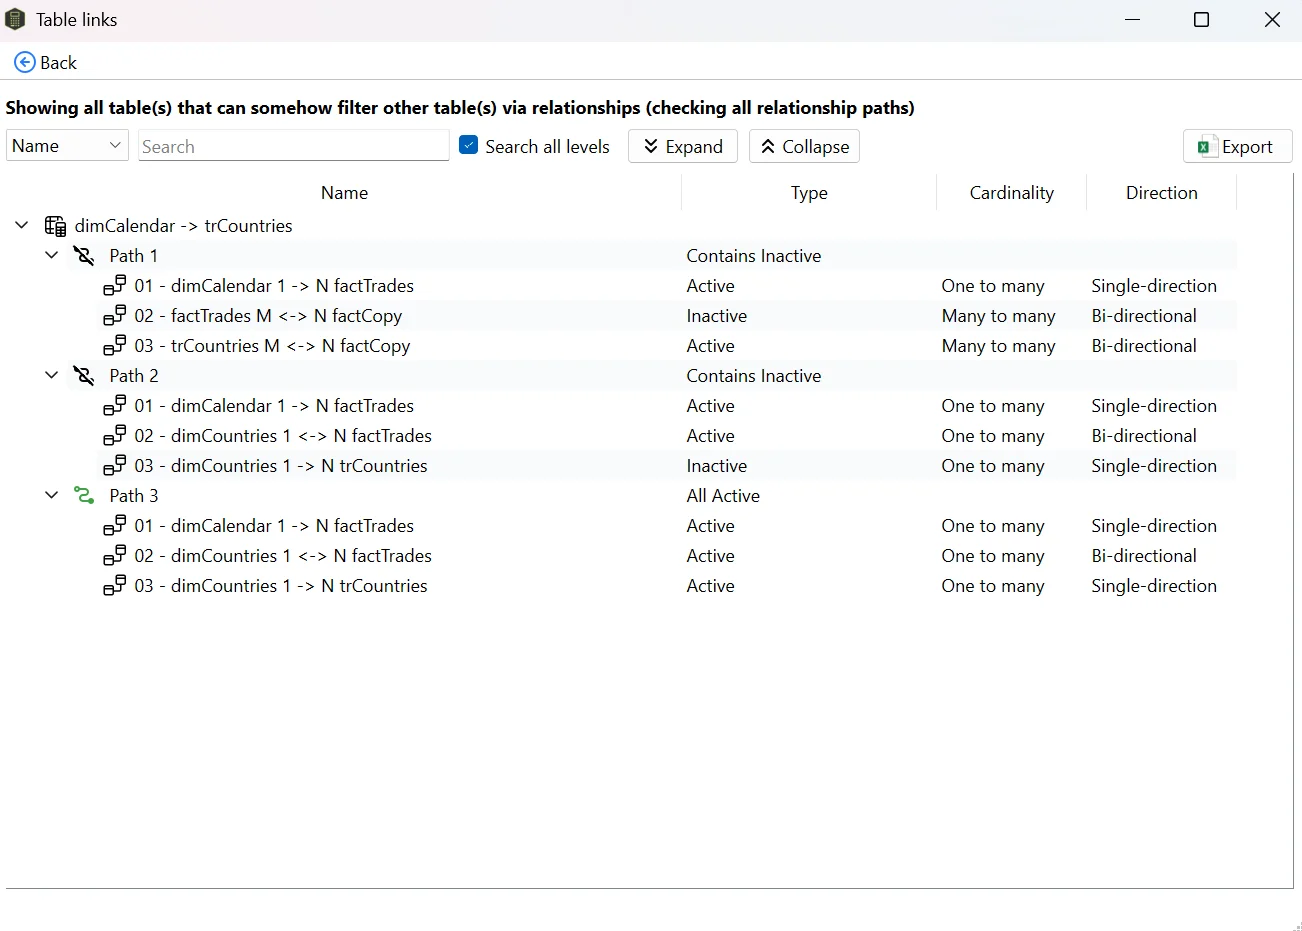
After clicking Next, Measure Killer displays all valid paths between the selected tables - each path showing every relationship in the chain, its direction, cardinality, and whether it’s active or inactive.
In this example, three distinct paths connect dimCalendar to
trCountries - two through inactive relationships and one through
active relationships. The results detail every relationship in each
path.
What you learn
In a typical messy model, you’ll often find multiple paths between two tables - some through active relationships, some through inactive ones. This tells you:
- Which filters are actually active - only paths through active relationships propagate filters by default.
- What USERELATIONSHIP can activate - inactive paths show what becomes possible when a DAX measure explicitly activates a relationship.
- Where redundancy exists - if two active paths reach the same table, you may have ambiguous filter propagation that produces unexpected results.
When combined with the Relationships tab, Table Relations helps identify optimization opportunities - unused inactive relationships that can be removed, and occasionally redundant active ones that cause ambiguous filter behavior.
Related
- Best-practice analysis - catches bi-directional and many-to-many relationship anti-patterns
- Dependency tree - visualize how measures and columns depend on each other