 Measure Killer
Finding duplicate semantic models in Power BI and Fabric
Side-by-side TMDL diffs break past two models. A similarity score across tables, columns, measures, and relationships finds every near-duplicate model at once.
The challenge
We’ve all seen it: semantic models being built from the same data source, containing almost the same tables and columns.
Over time, in every organization - due to data silos, a lack of permissions, or just not knowing that a model already exists - teams create new models, and redundancy grows.
The result is a growing number of models that are very similar but nobody knows are (almost) duplicates of one another. Only by comparing the semantic models in a qualitative way - comparing every table with all its columns, relationships and so on - can you find out how similar they actually are.
Why other comparison methods fall short
One of the few available ways to compare two Power BI semantic models is by looking at their TMDL representation. While this can provide useful information, it requires a lot of work to determine all the differences between two models and the process usually only works for comparing two models at a time.
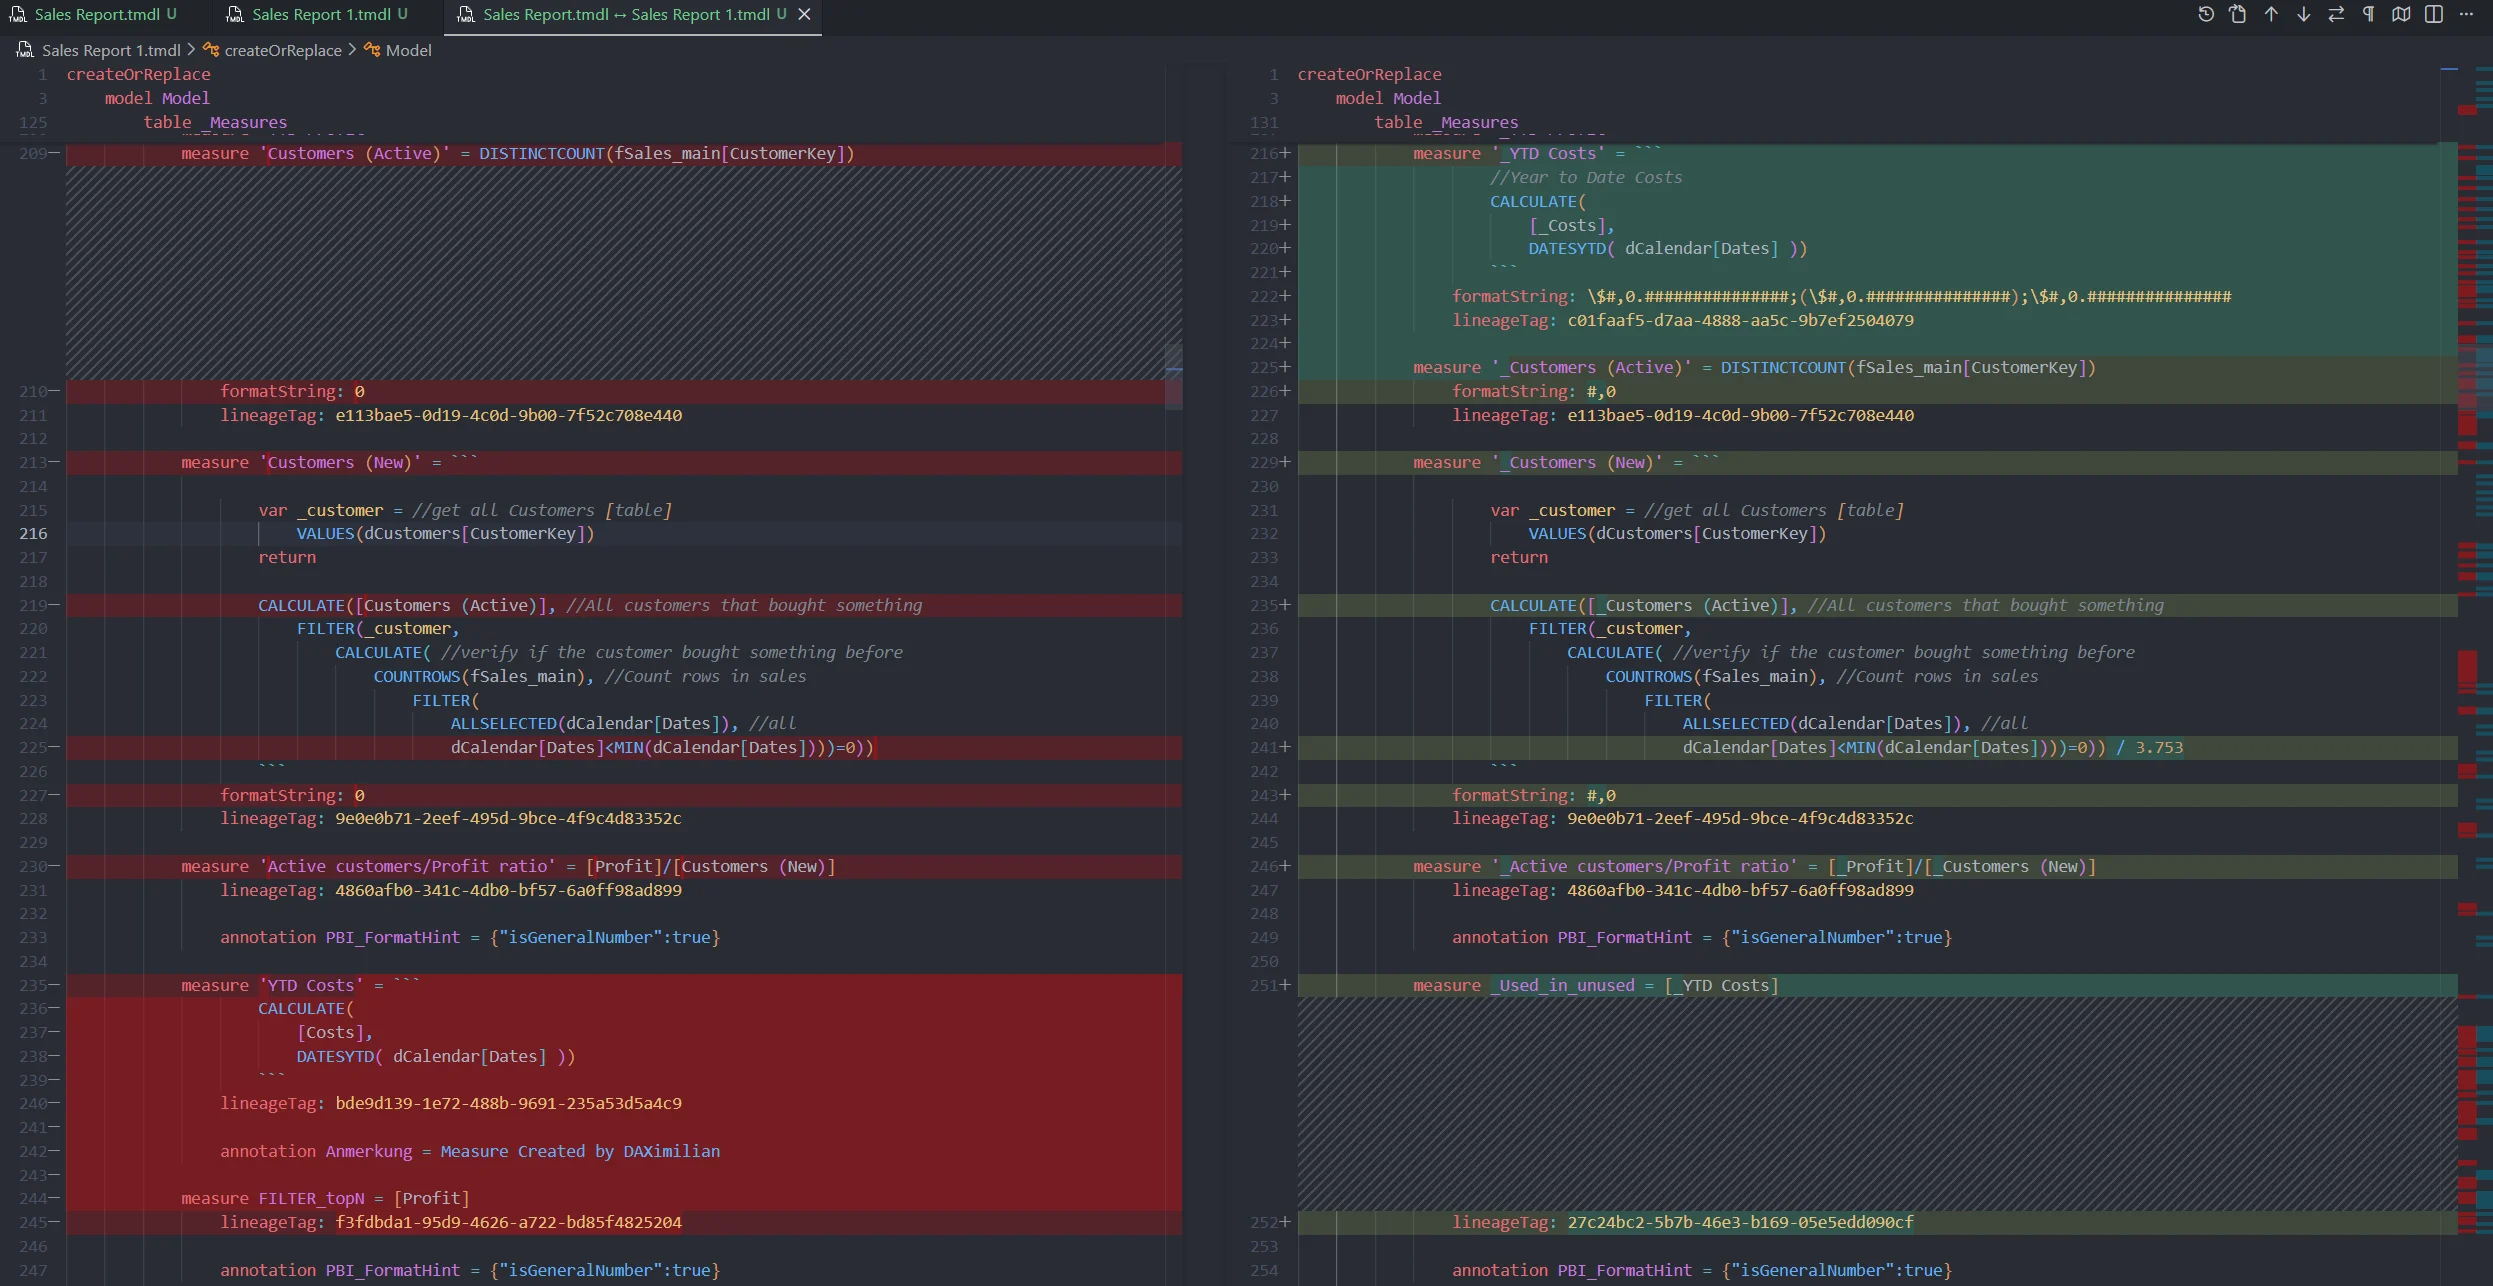
This approach does not scale very well, nor does it provide a clear, objective way to identify how similar two models actually are.
The solution: Model Similarity in Measure Killer
That’s why we developed a new tool inside Measure Killer called Model Similarity. It’s designed specifically to tackle this kind of problem, using all the metadata Measure Killer collects on semantic models to compare them in a very intricate and customizable way.
Model Similarity evaluates models across multiple attributes and assigns a similarity score to each comparison. The score shows how closely two models resemble each other, while still letting you drill into the exact differences that contribute to that score.
The comparison includes attributes like:
- Name
- Size
- All measures
- All tables
- All columns
- All UDFs
- All relationships
- And many other traits
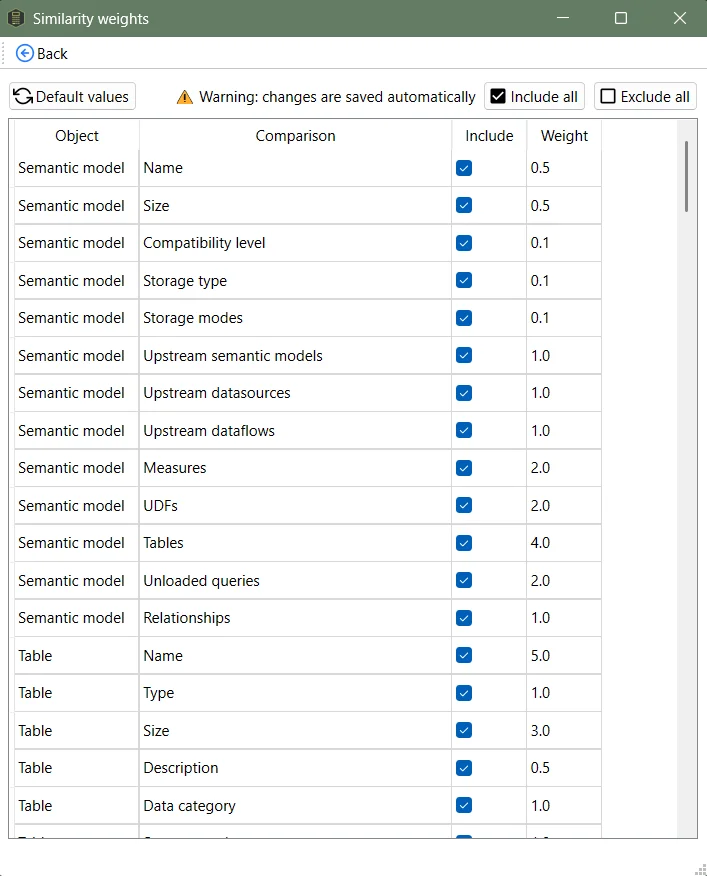
You can choose which attributes to take into account, and different weights can be set to rank their importance. This allows comparing multiple semantic models in a lot of different ways.
How to use Model Similarity
To access this feature, select either the Tenant Analysis or Limited Tenant Analysis modes and analyze (in the Selection tab) all semantic models you want to compare. Afterwards, click on the Model similarity button located on the top.
The button will only be enabled if you’ve run a model in the Selection tab beforehand.
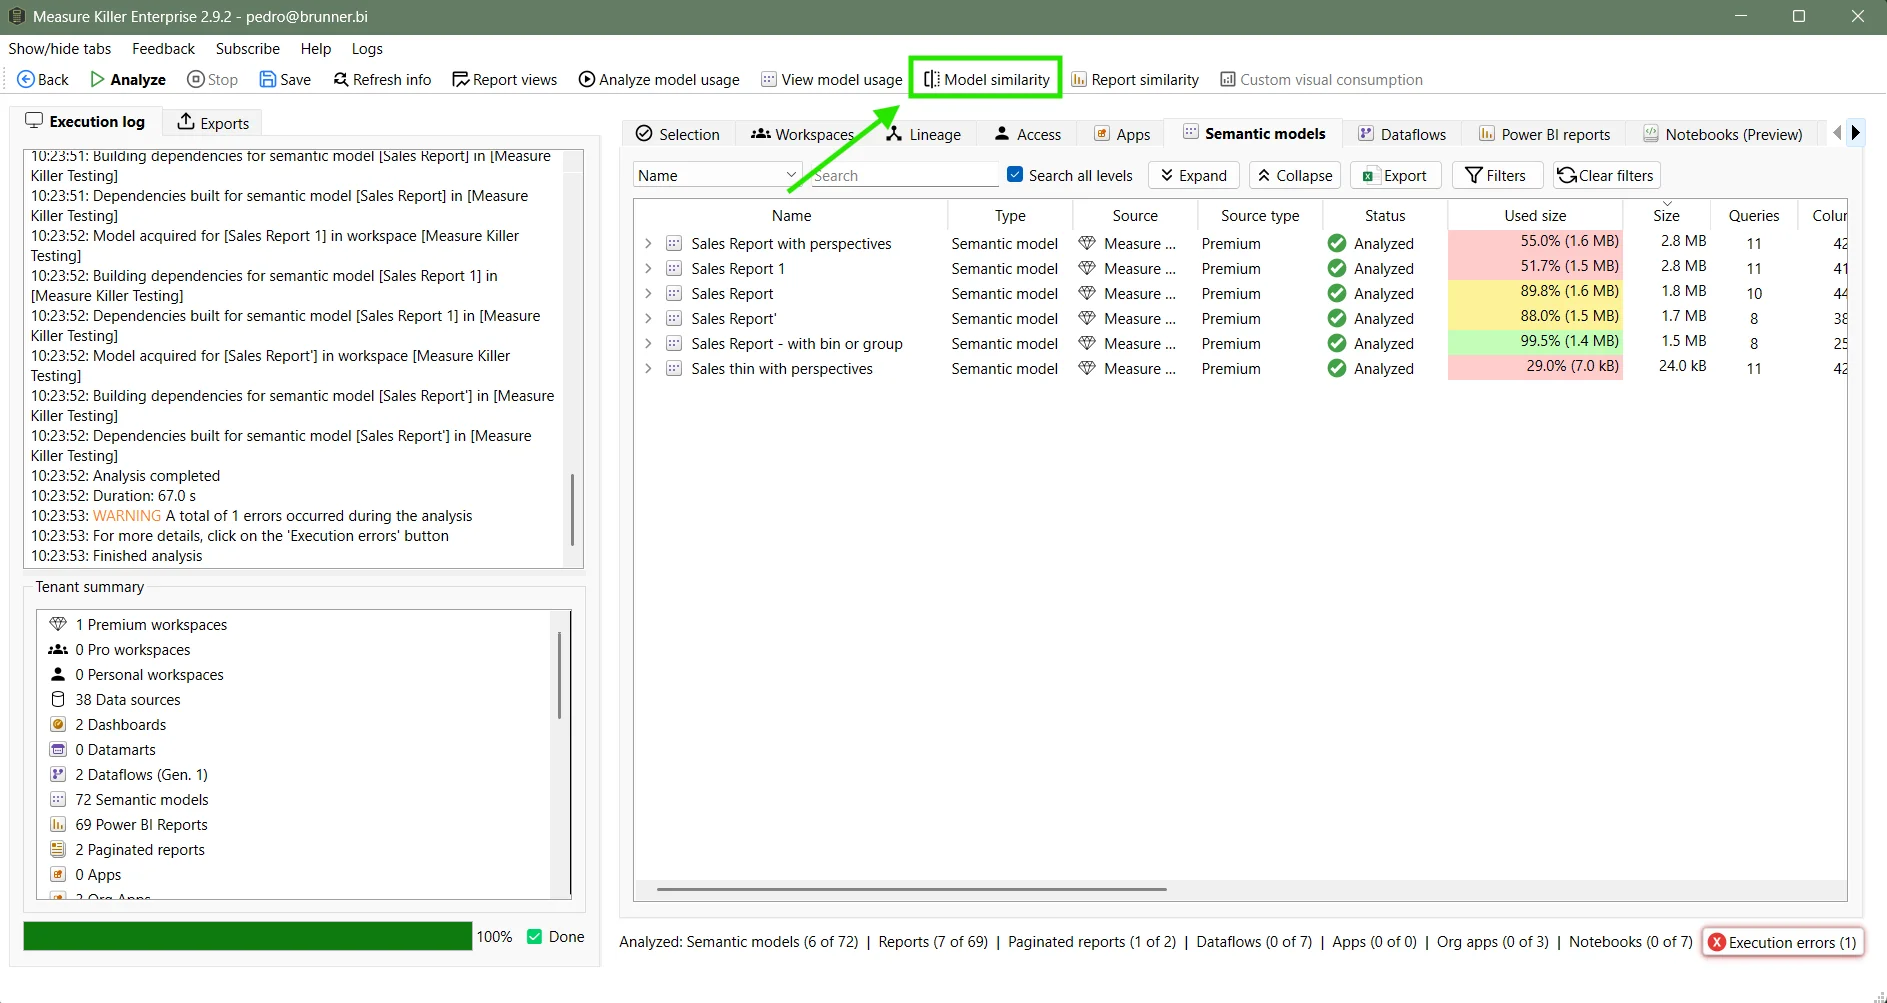
This opens another window, where you can select the semantic model(s) to find duplicates for. In our case we want to see how similar the Sales Report model is to all other models we have access to.
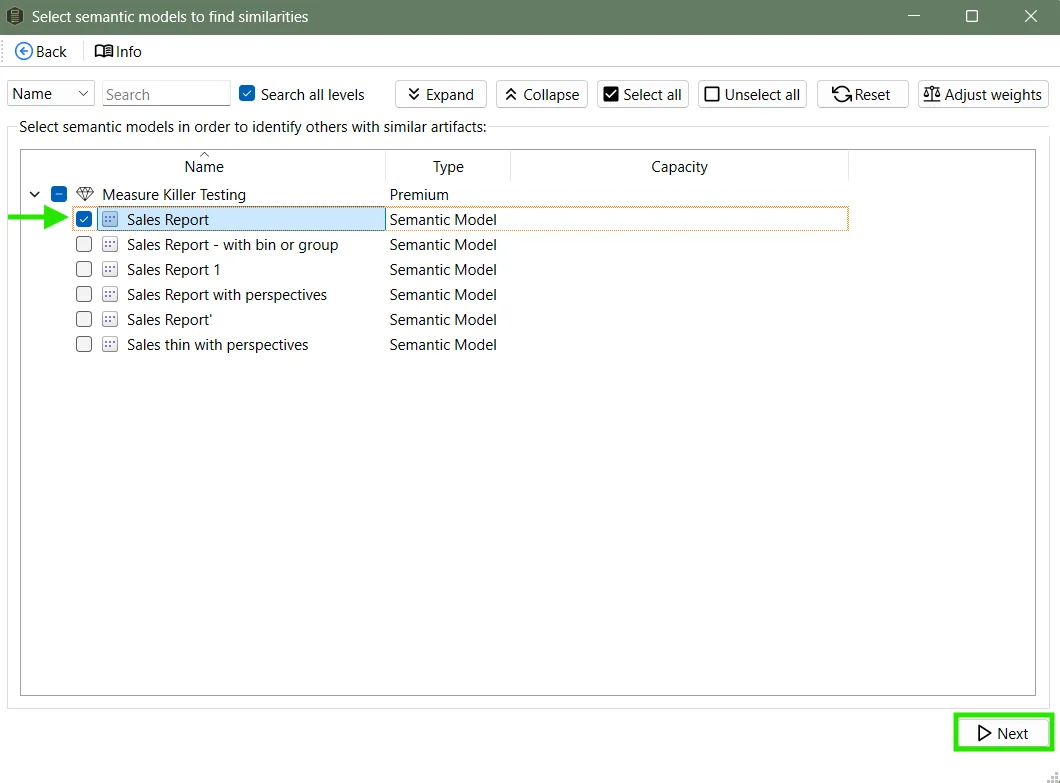
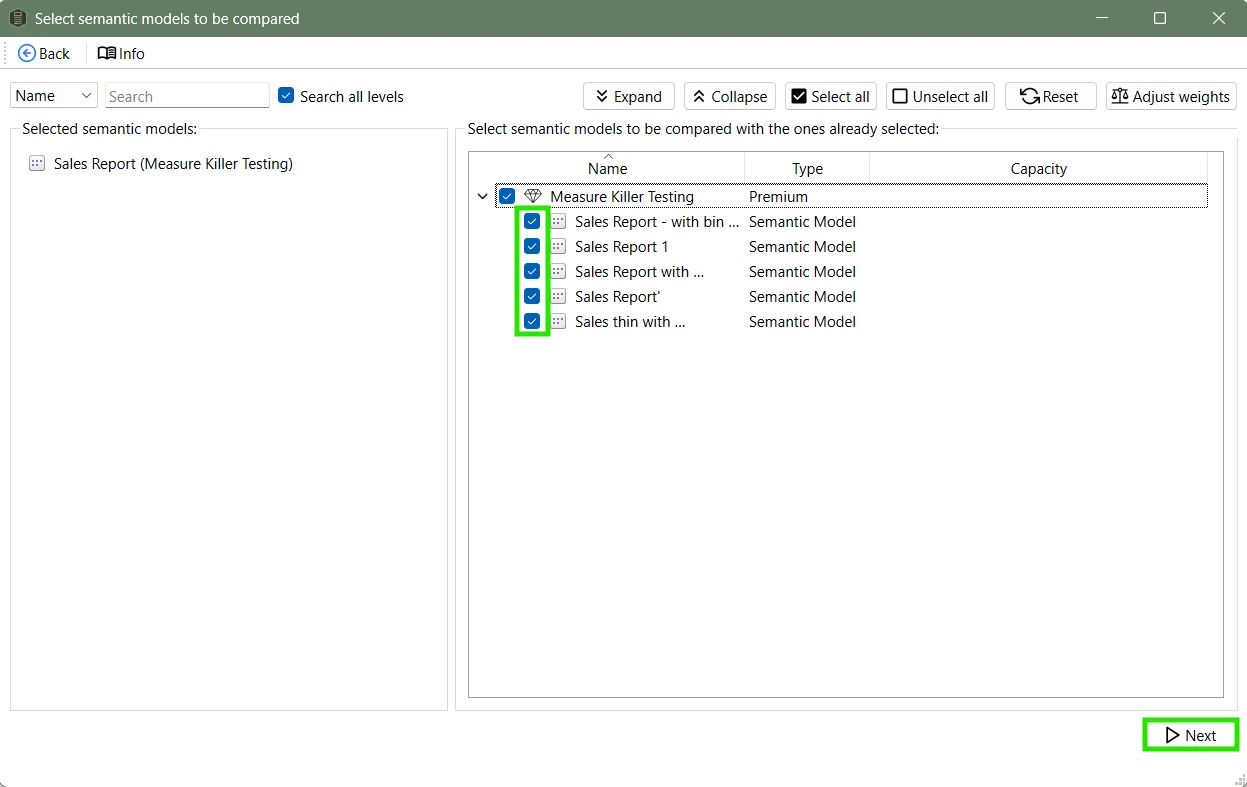
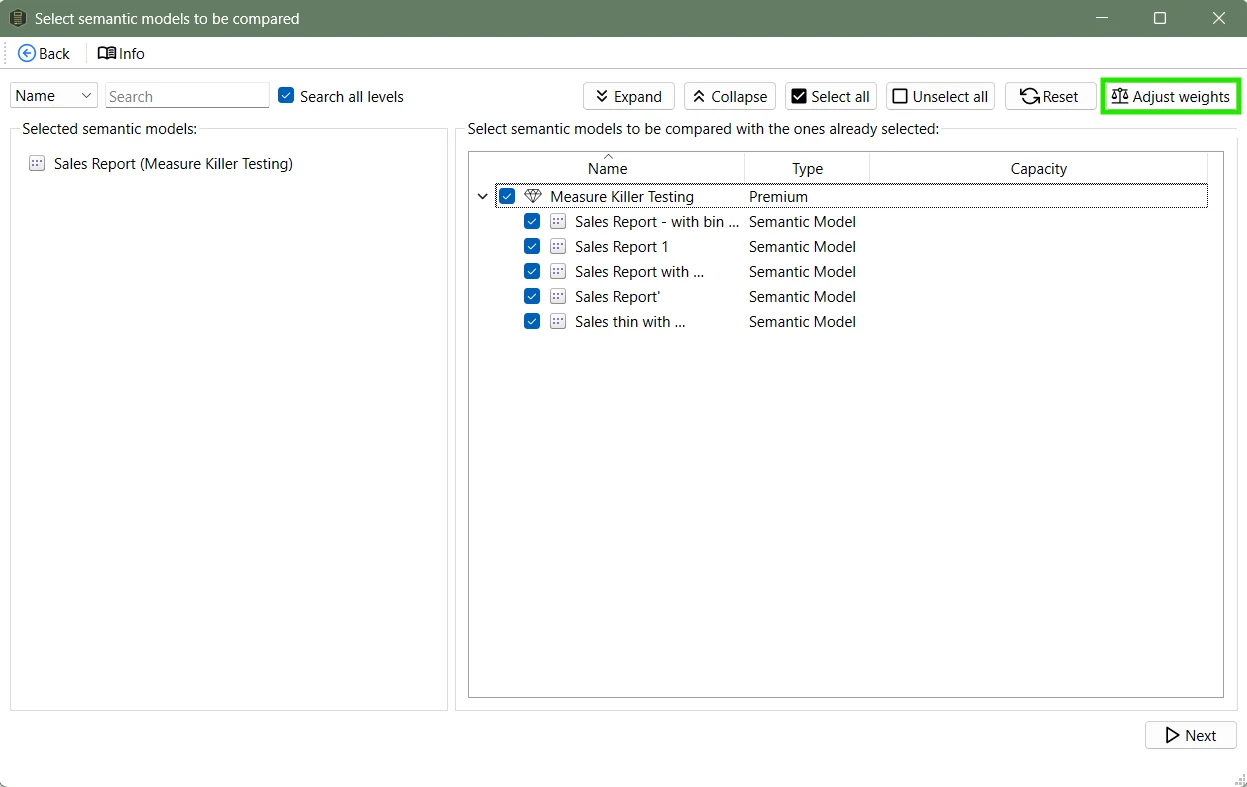
In the next window, you’ll be able to select which semantic models we want our Sales Report to be compared against.
Interpreting the results
Measure Killer runs the similarity analysis and assigns a similarity score between every pair of models. The higher the score, the more similar the models are. Click Similarity details to see what exactly makes up the score - what’s the same and what’s different between the models you selected.
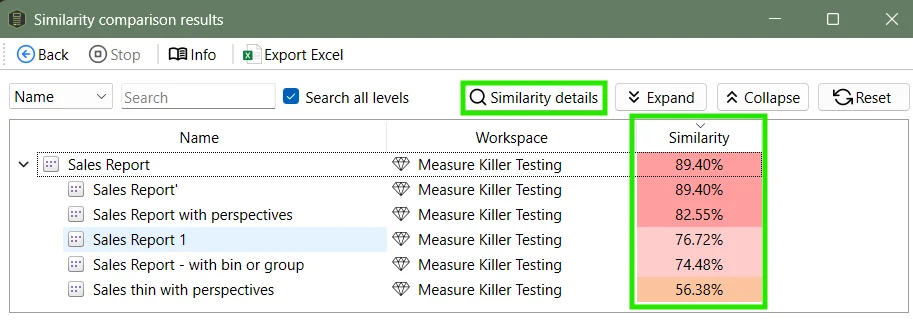
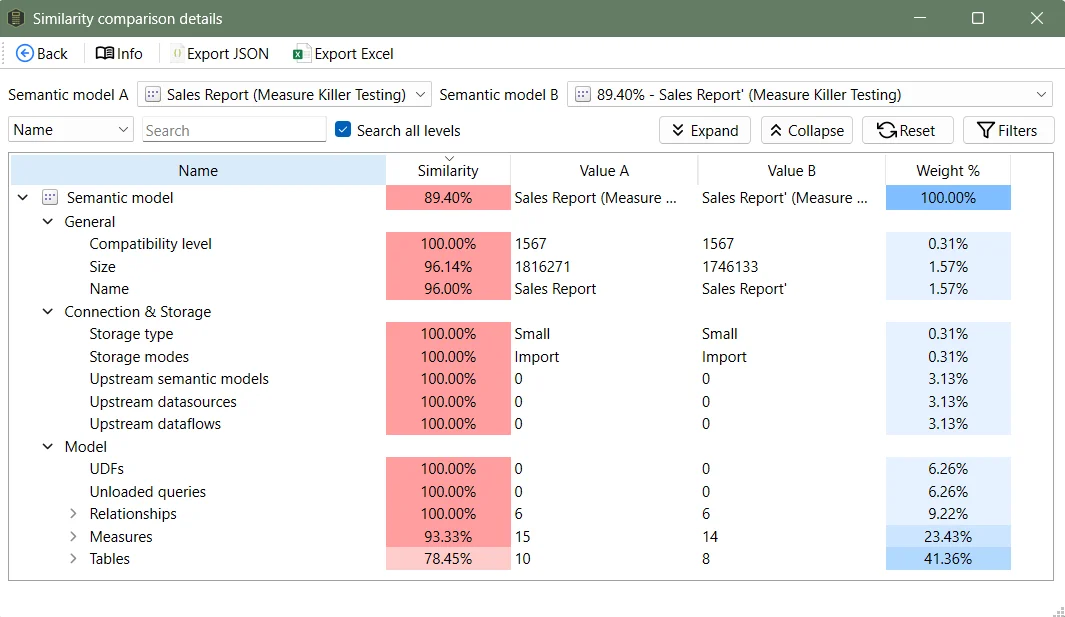
Similarity scores use a red-to-green color scale, with red signaling high similarity - typically a bad sign. In this example, the Sales Report model has a very similar model called Sales Report’, in the same workspace:
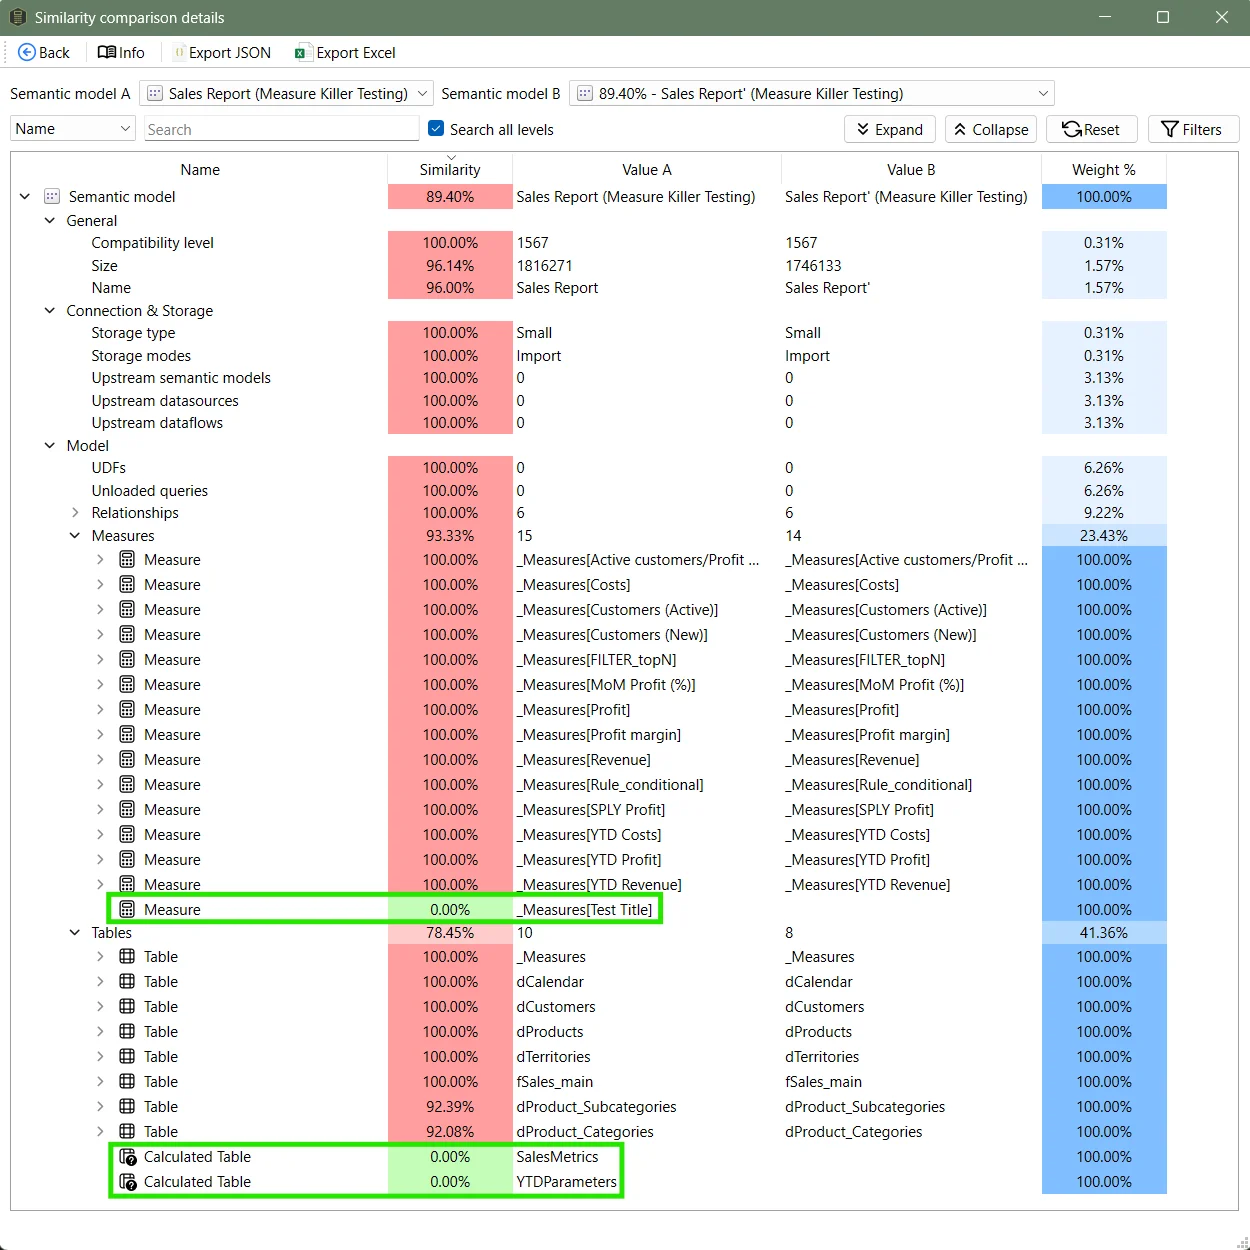
Now it gets interesting: a lot of things are exactly the same (100% similar) between the two models. Value A and Value B show the respective values or number of artifacts - e.g. for Relationships - for each model.
Measure Killer also shows us that the Sales Report has two extra calculated tables and one extra measure compared to the other semantic model. Expanding the measures section reveals exactly which ones.
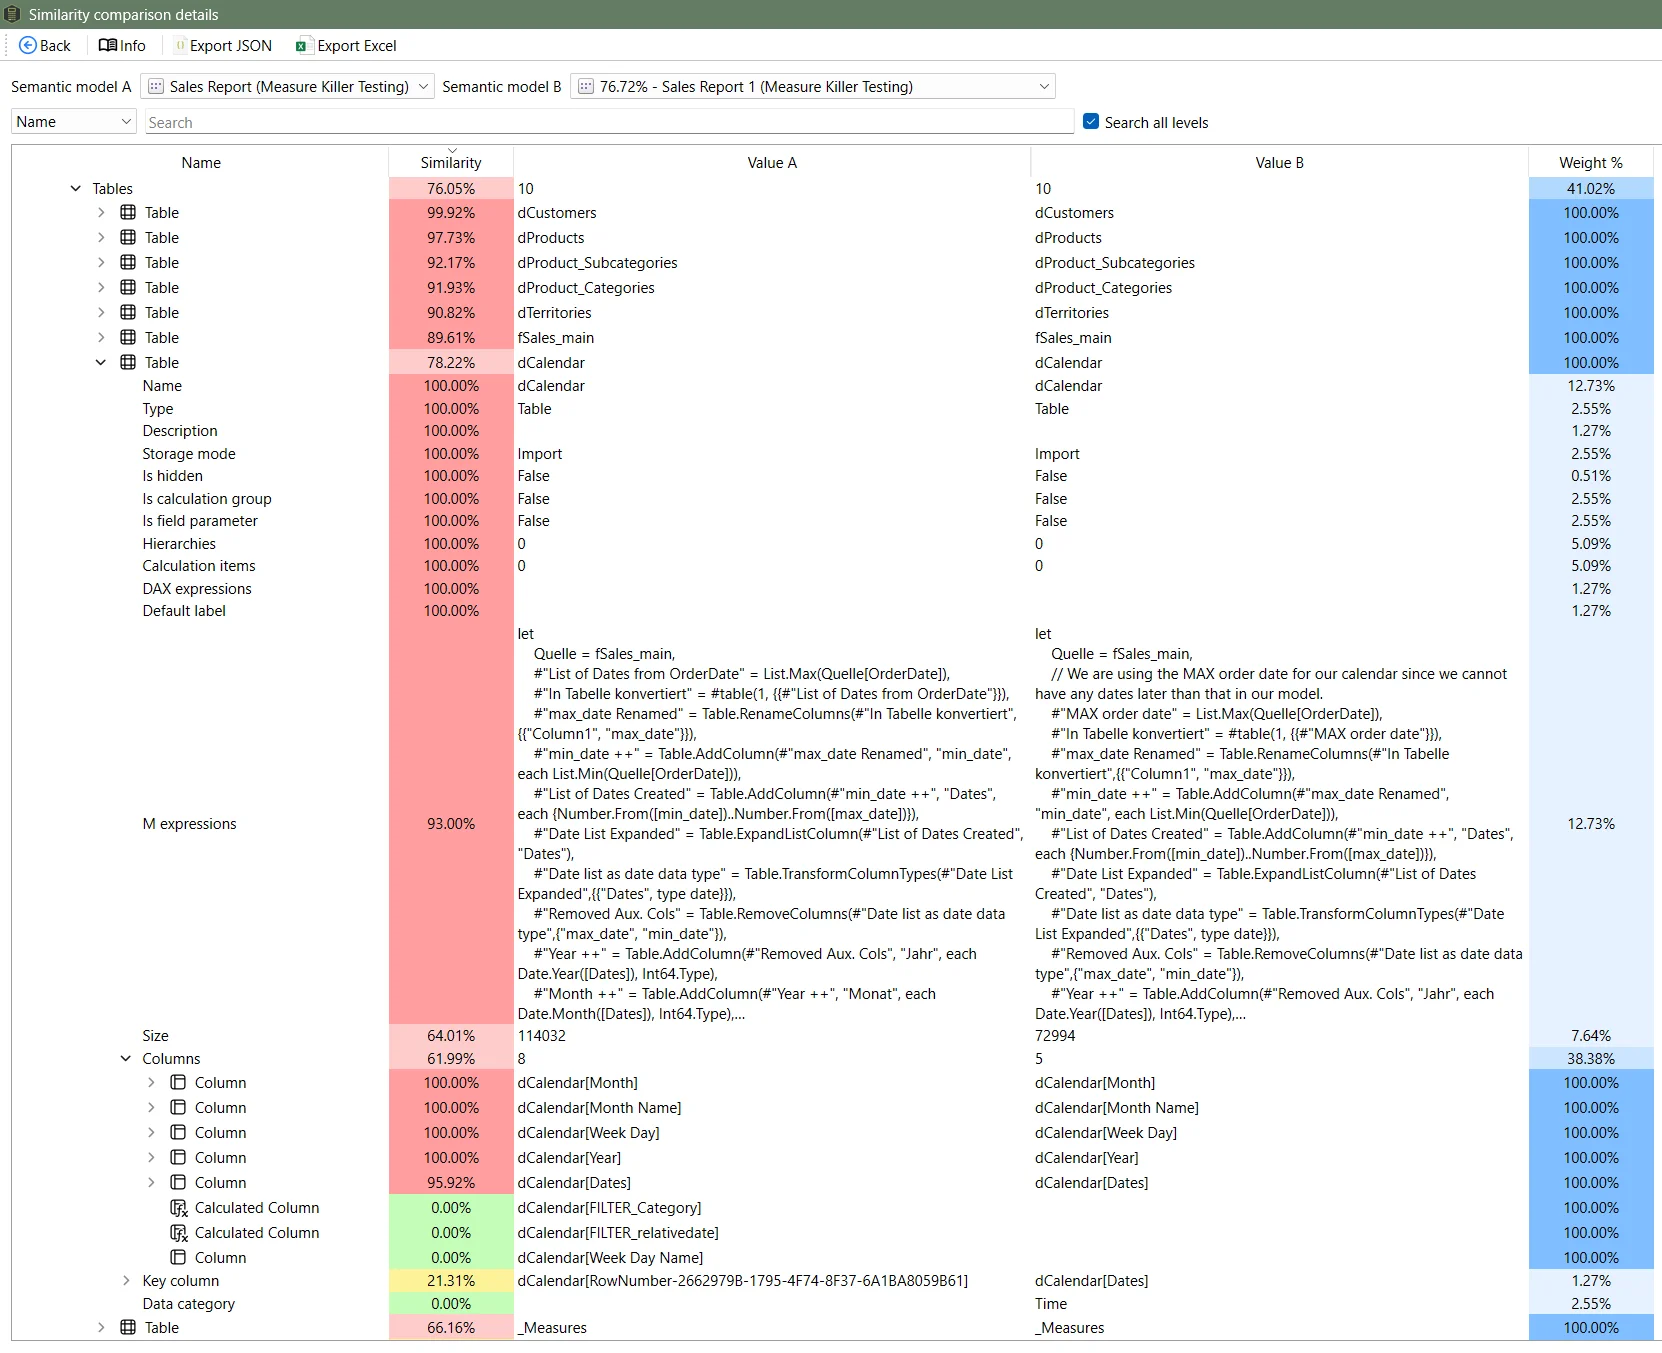
When comparing our Sales Report to another model - in this case Sales Report 1 - we can see differences for tables and columns.
To change the weights used to calculate the similarity score, or to choose only some parts to compare, click Adjust weights in the window earlier (you might have to go back a few times):
Here, the weights can be customized:
Conclusion
Model Similarity provides an easy and customizable way to understand how semantic models compare to each other. By combining quantitative similarity scores with detailed comparisons, it helps you make informed decisions about which models to consolidate.
If you want to try out the full version of Measure Killer, you can request a trial here.