Find duplicate semantic models in Power BI
Compare every Power BI semantic model in your tenant with a pairwise similarity score — the fastest way to find duplicates and near-duplicates to consolidate.
Last updated · May 25, 2026
The challenge
We’ve all seen it: semantic models being built from the same data source, containing almost the same tables and columns.
Over time, in every organization — due to data silos, a lack of permissions, or just not knowing that a model already exists — teams create new models, and redundancy grows.
The result is a growing number of models that are very similar but nobody knows are (almost) duplicates of one another. Only by comparing the semantic models in a qualitative way — comparing every table with all its columns, relationships and so on — can you find out how similar they actually are.
Why other comparison methods fall short
One of the few available ways to compare two Power BI semantic models is by looking at their TMDL representation. While this can provide useful information, it requires a lot of work to determine all the differences between two models and the process usually only works for comparing two models at a time.
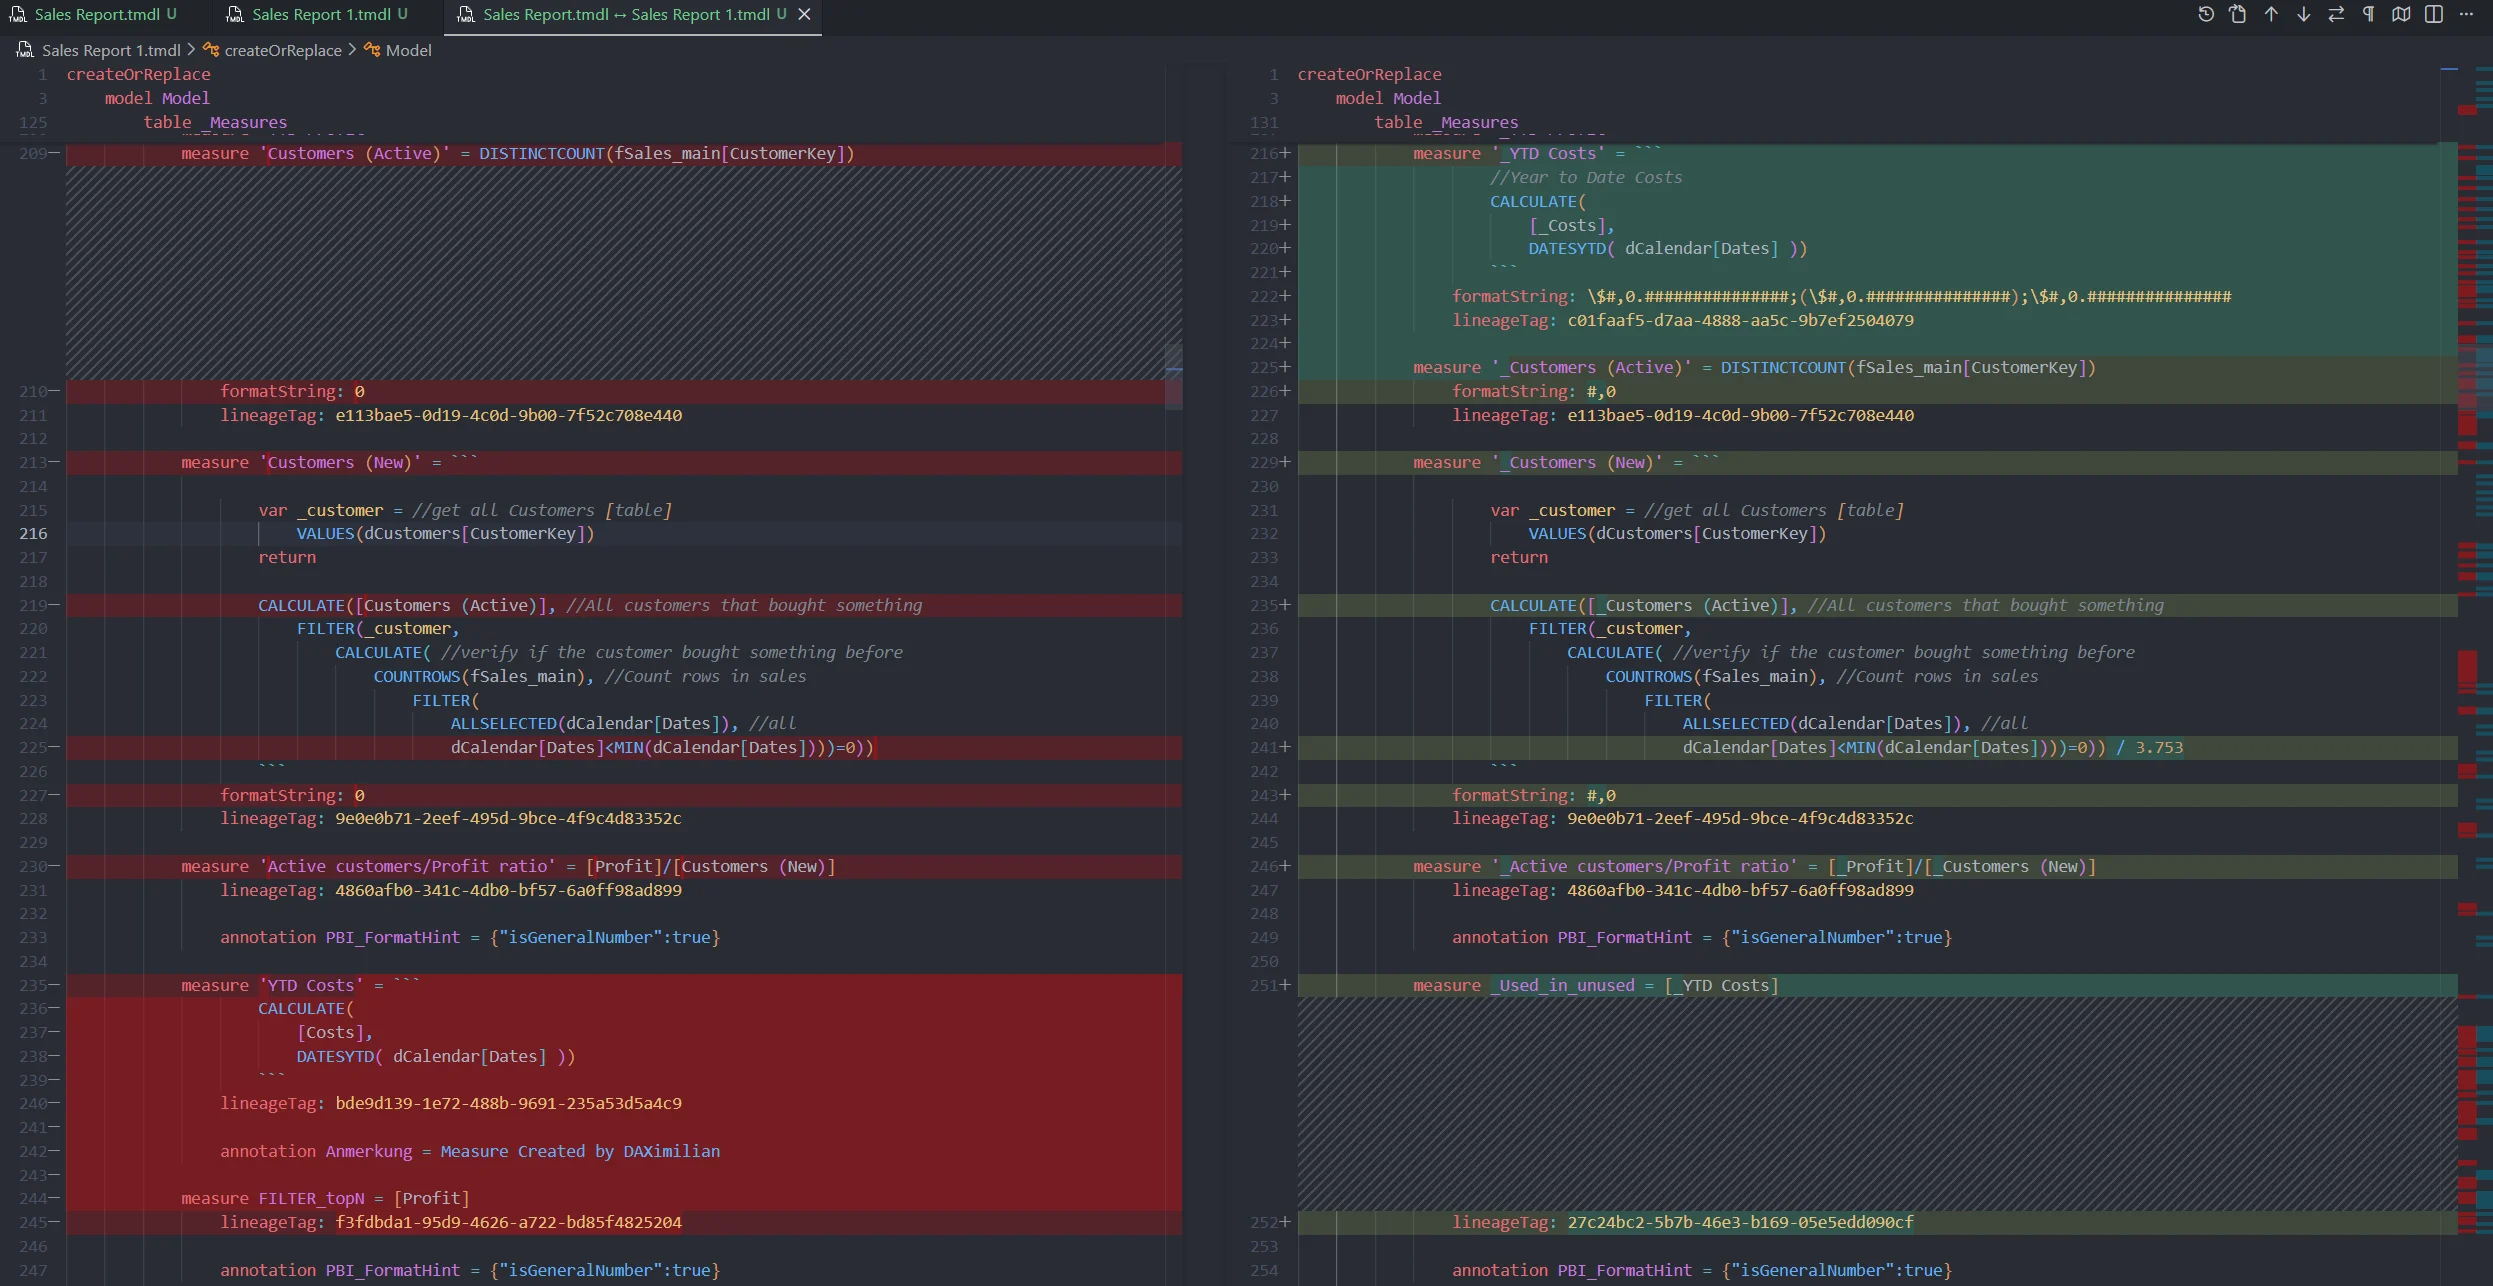
This approach does not scale very well, nor does it provide a clear, objective way to identify how similar two models actually are.
How Model Similarity works
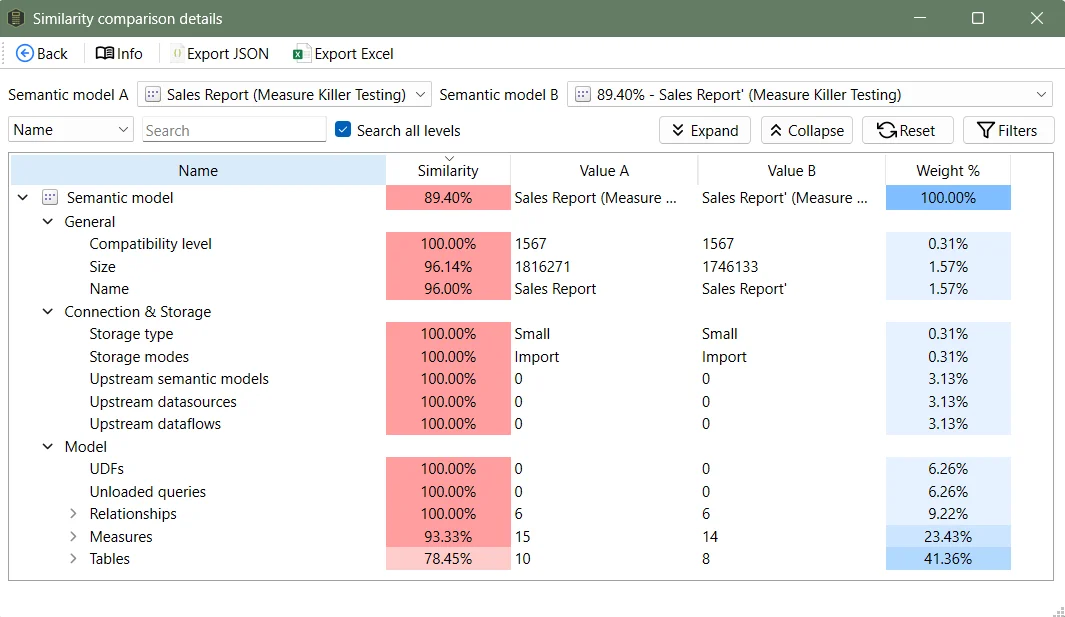
Model Similarity evaluates models across multiple attributes and assigns a similarity score to each comparison. The score shows how closely two models resemble each other, while still letting you drill into the exact differences that contribute to that score.
The comparison includes attributes like:
- Name
- Size
- All measures
- All tables
- All columns
- All UDFs
- All relationships
- And many other traits
You can choose which attributes to take into account, and different weights can be set to rank their importance. This allows comparing multiple semantic models in a lot of different ways.
Run the analysis
Prerequisite: You need a completed tenant or workspace scan before you can compare models. Model Similarity is computed from the metadata that scan collects. If you haven’t run one yet, follow Run a tenant-wide scan first — that doc also explains the difference between Tenant Analysis (Fabric Admin, full tenant) and Limited Tenant Analysis (Workspace Contributor, scoped to your workspaces). Make sure you include every model you want to compare in the scan — models that weren’t scanned won’t appear in the similarity view.
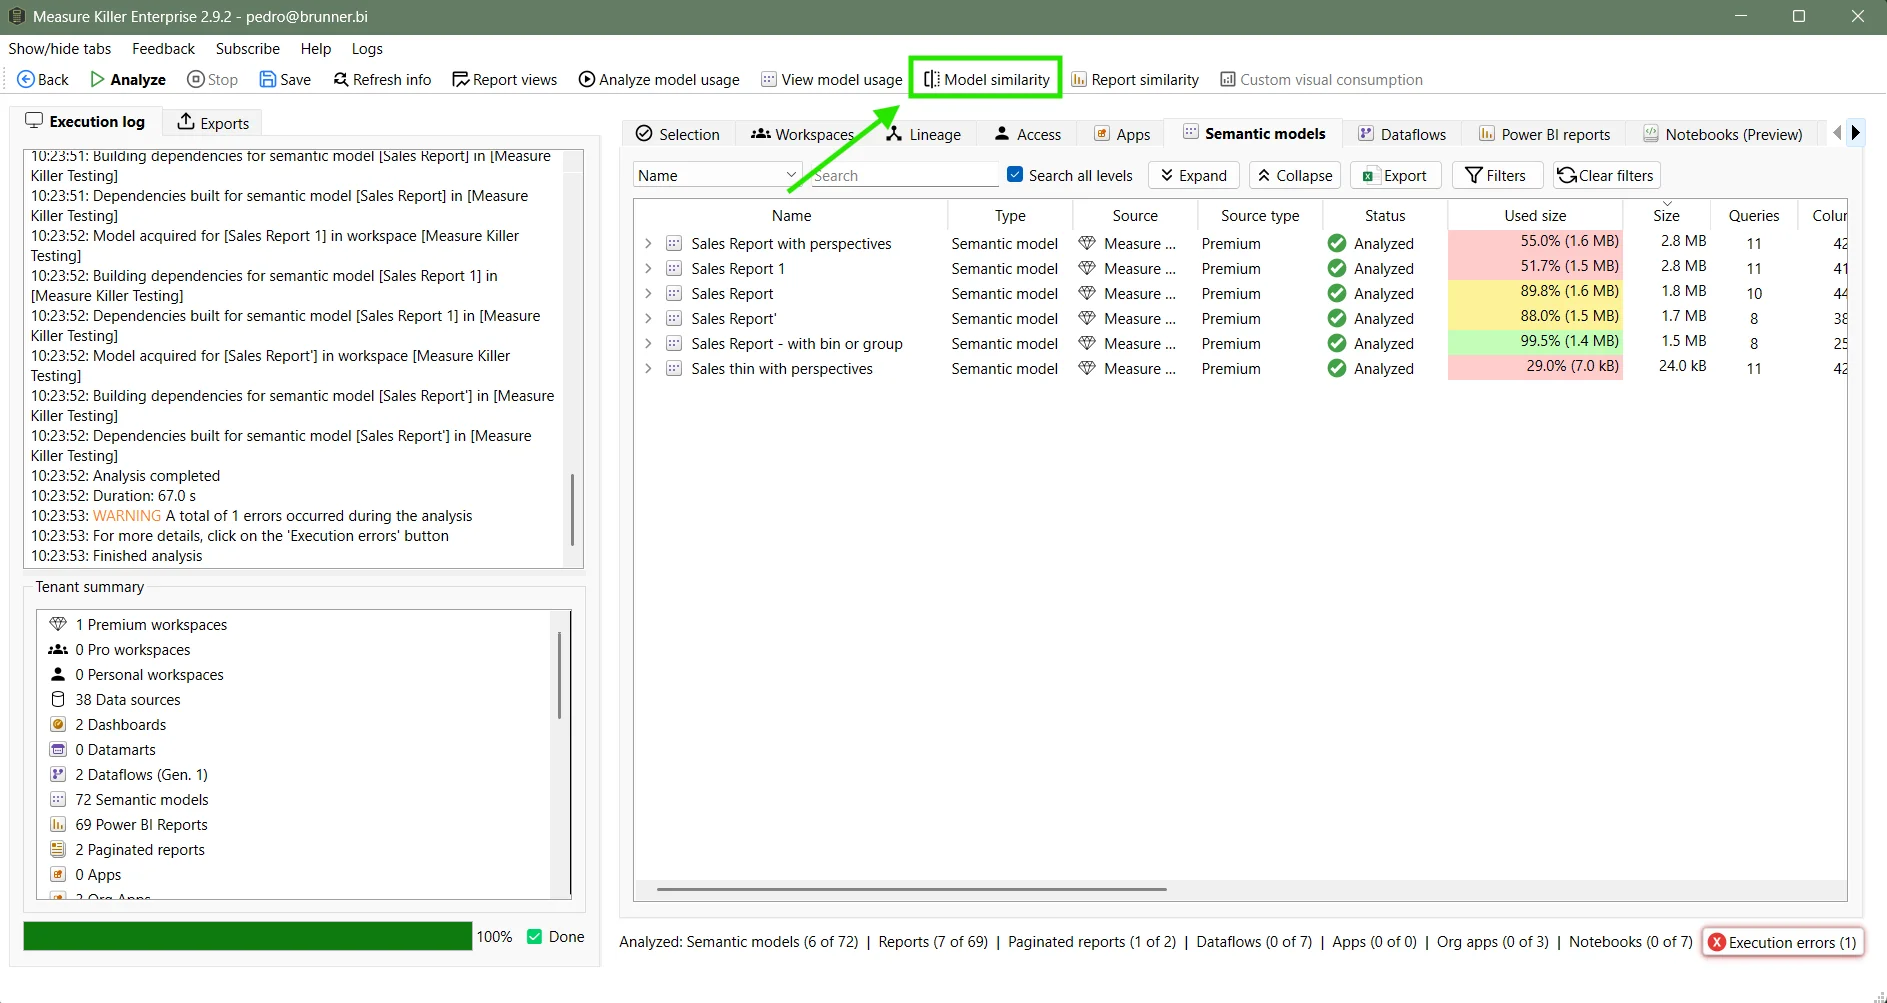
Once the scan finishes, click the Model similarity button in the top toolbar. The button is only enabled after at least one model has been analyzed.
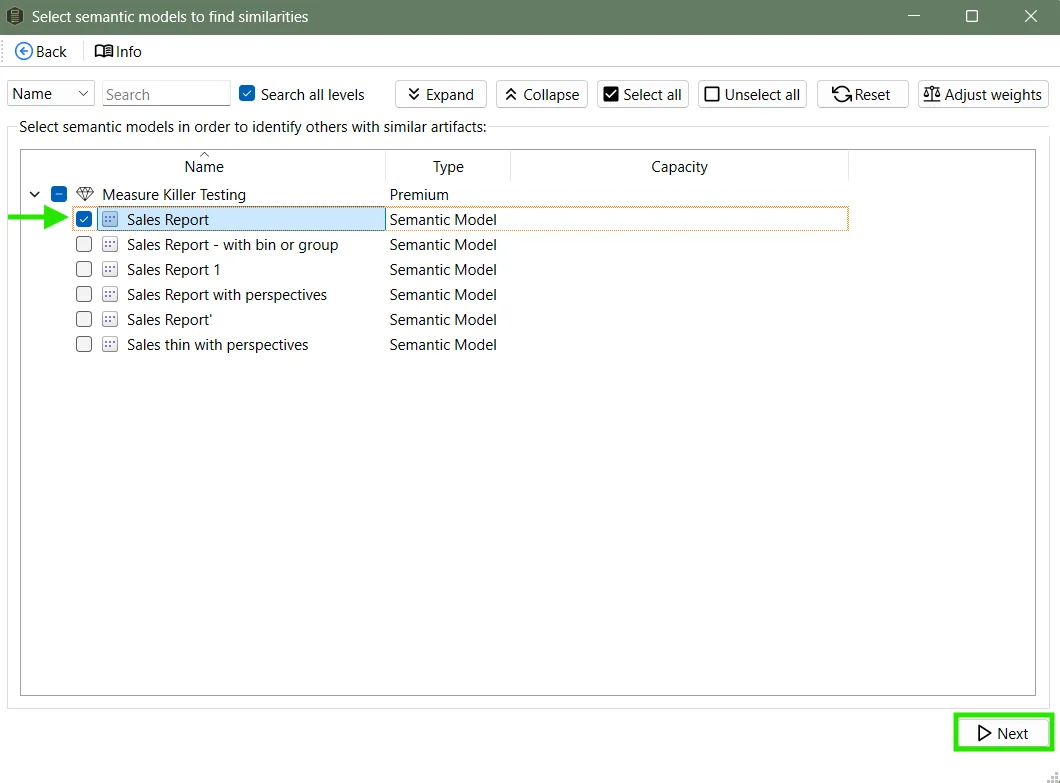
Select the semantic model(s) you want to find duplicates for.
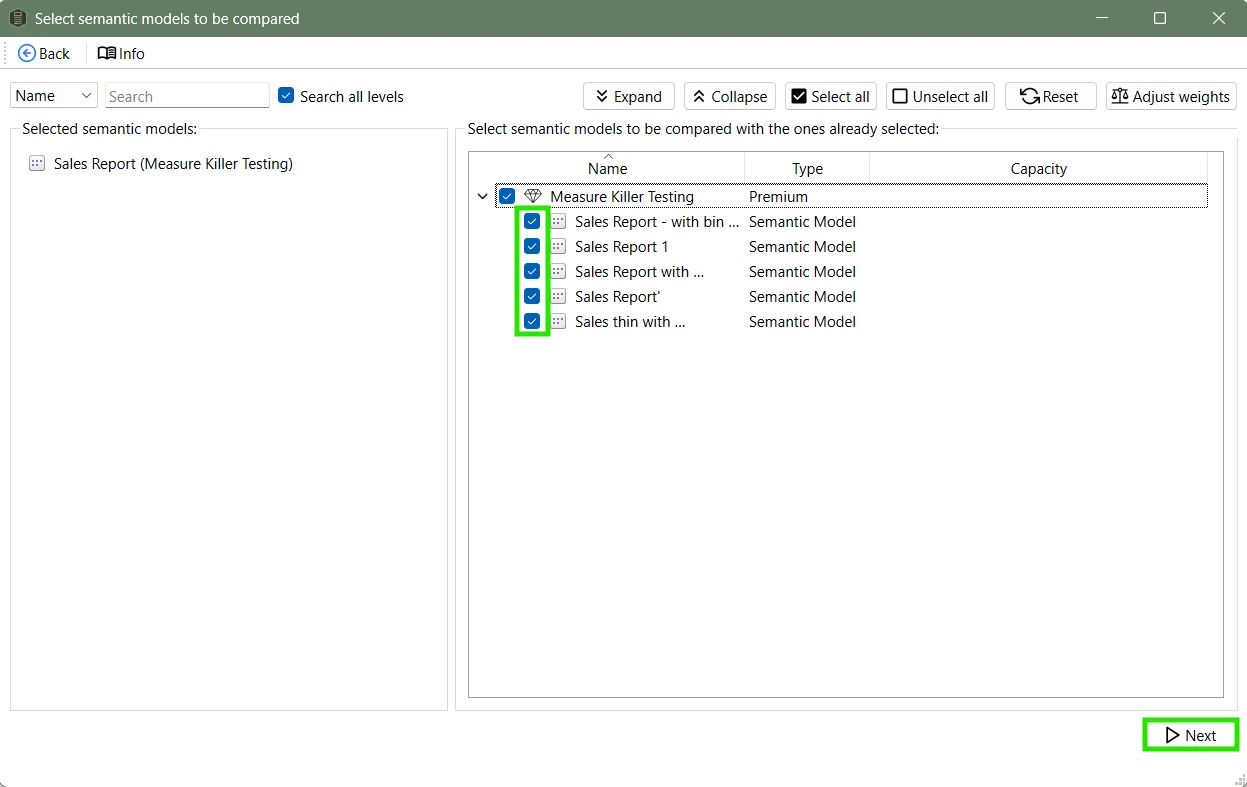
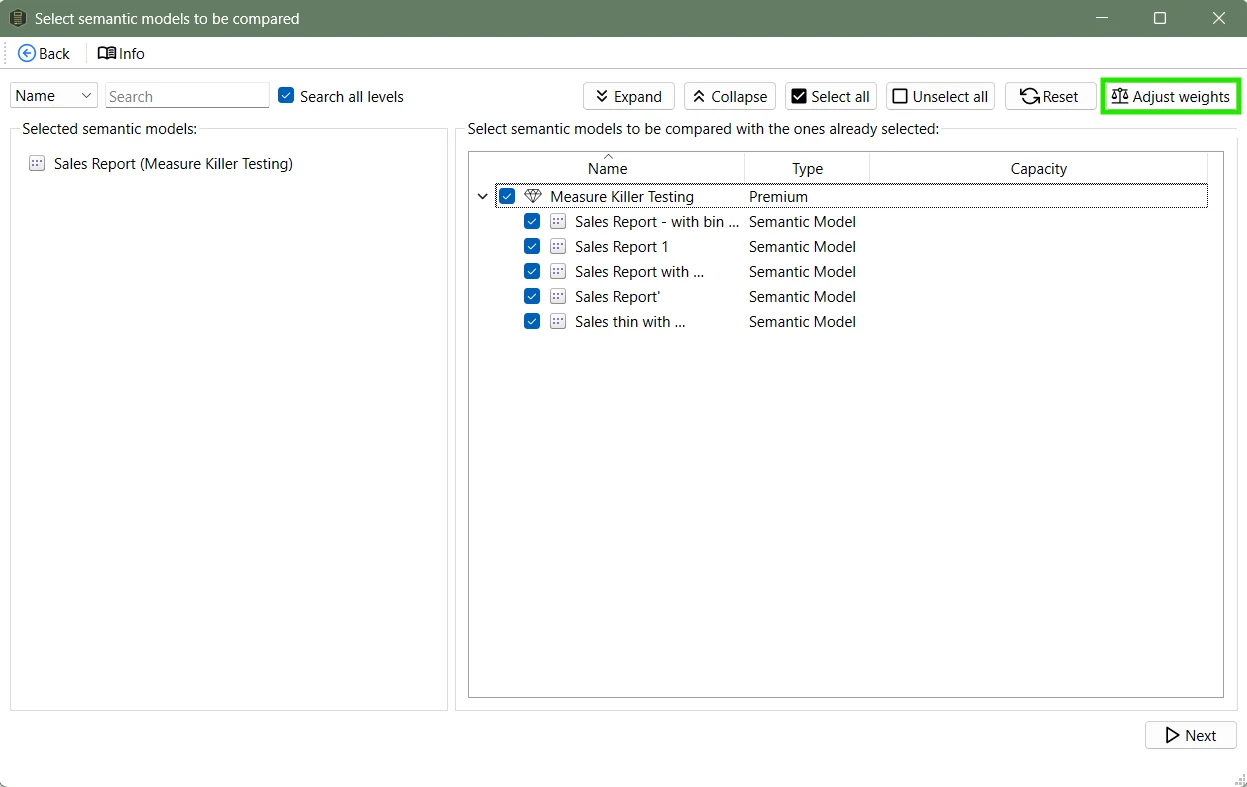
In the next window, select which semantic models to compare against. You can select all available models, or narrow it down to specific workspaces or models you suspect might be duplicates.
Interpreting the results
Measure Killer runs the similarity analysis and assigns a similarity score between every pair of models. The higher the score, the more similar the models are. Click Similarity details to see what exactly makes up the score — what’s the same and what’s different.
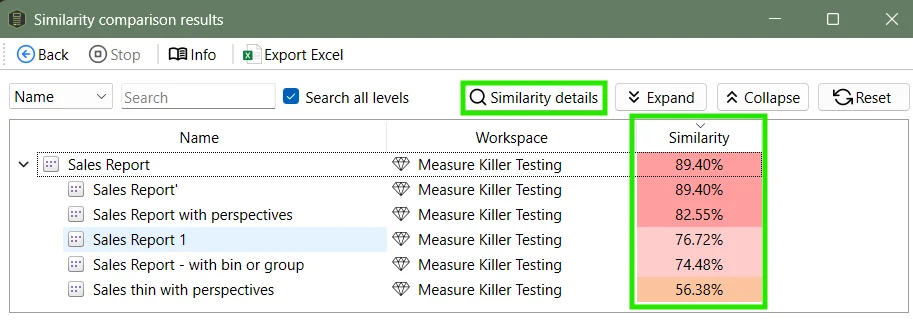
Similarity scores use a red-to-green color scale, with red signaling high similarity — typically a bad sign.
Measure Killer shows exactly what differs. Expanding the measures section reveals which ones exist in one model but not the other.
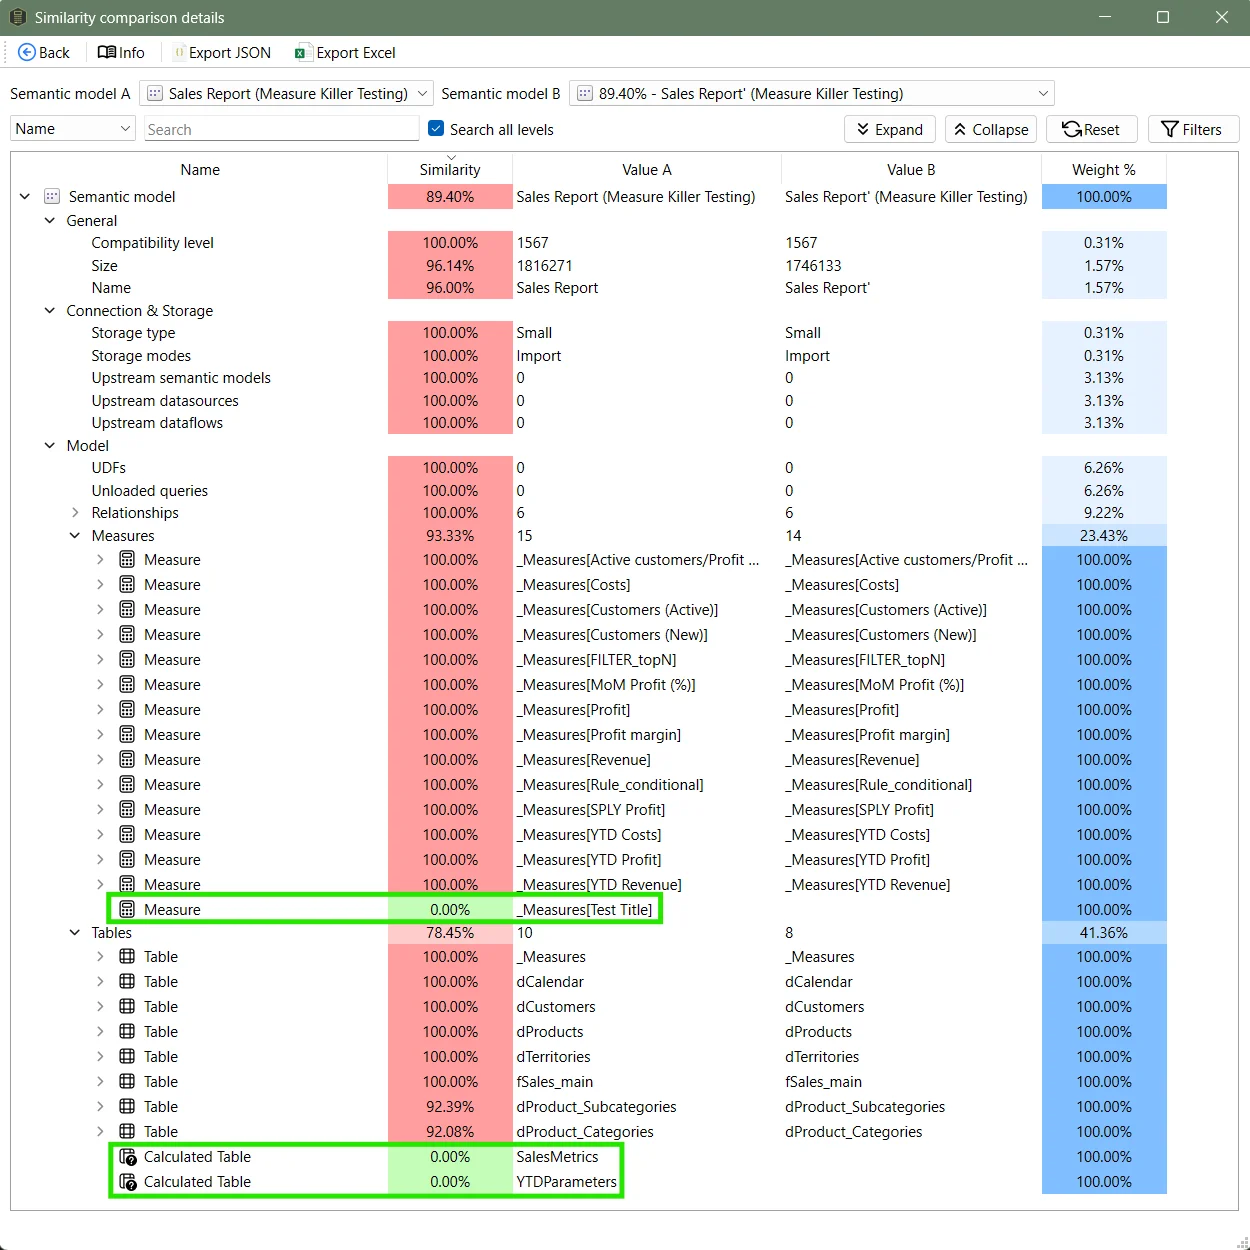
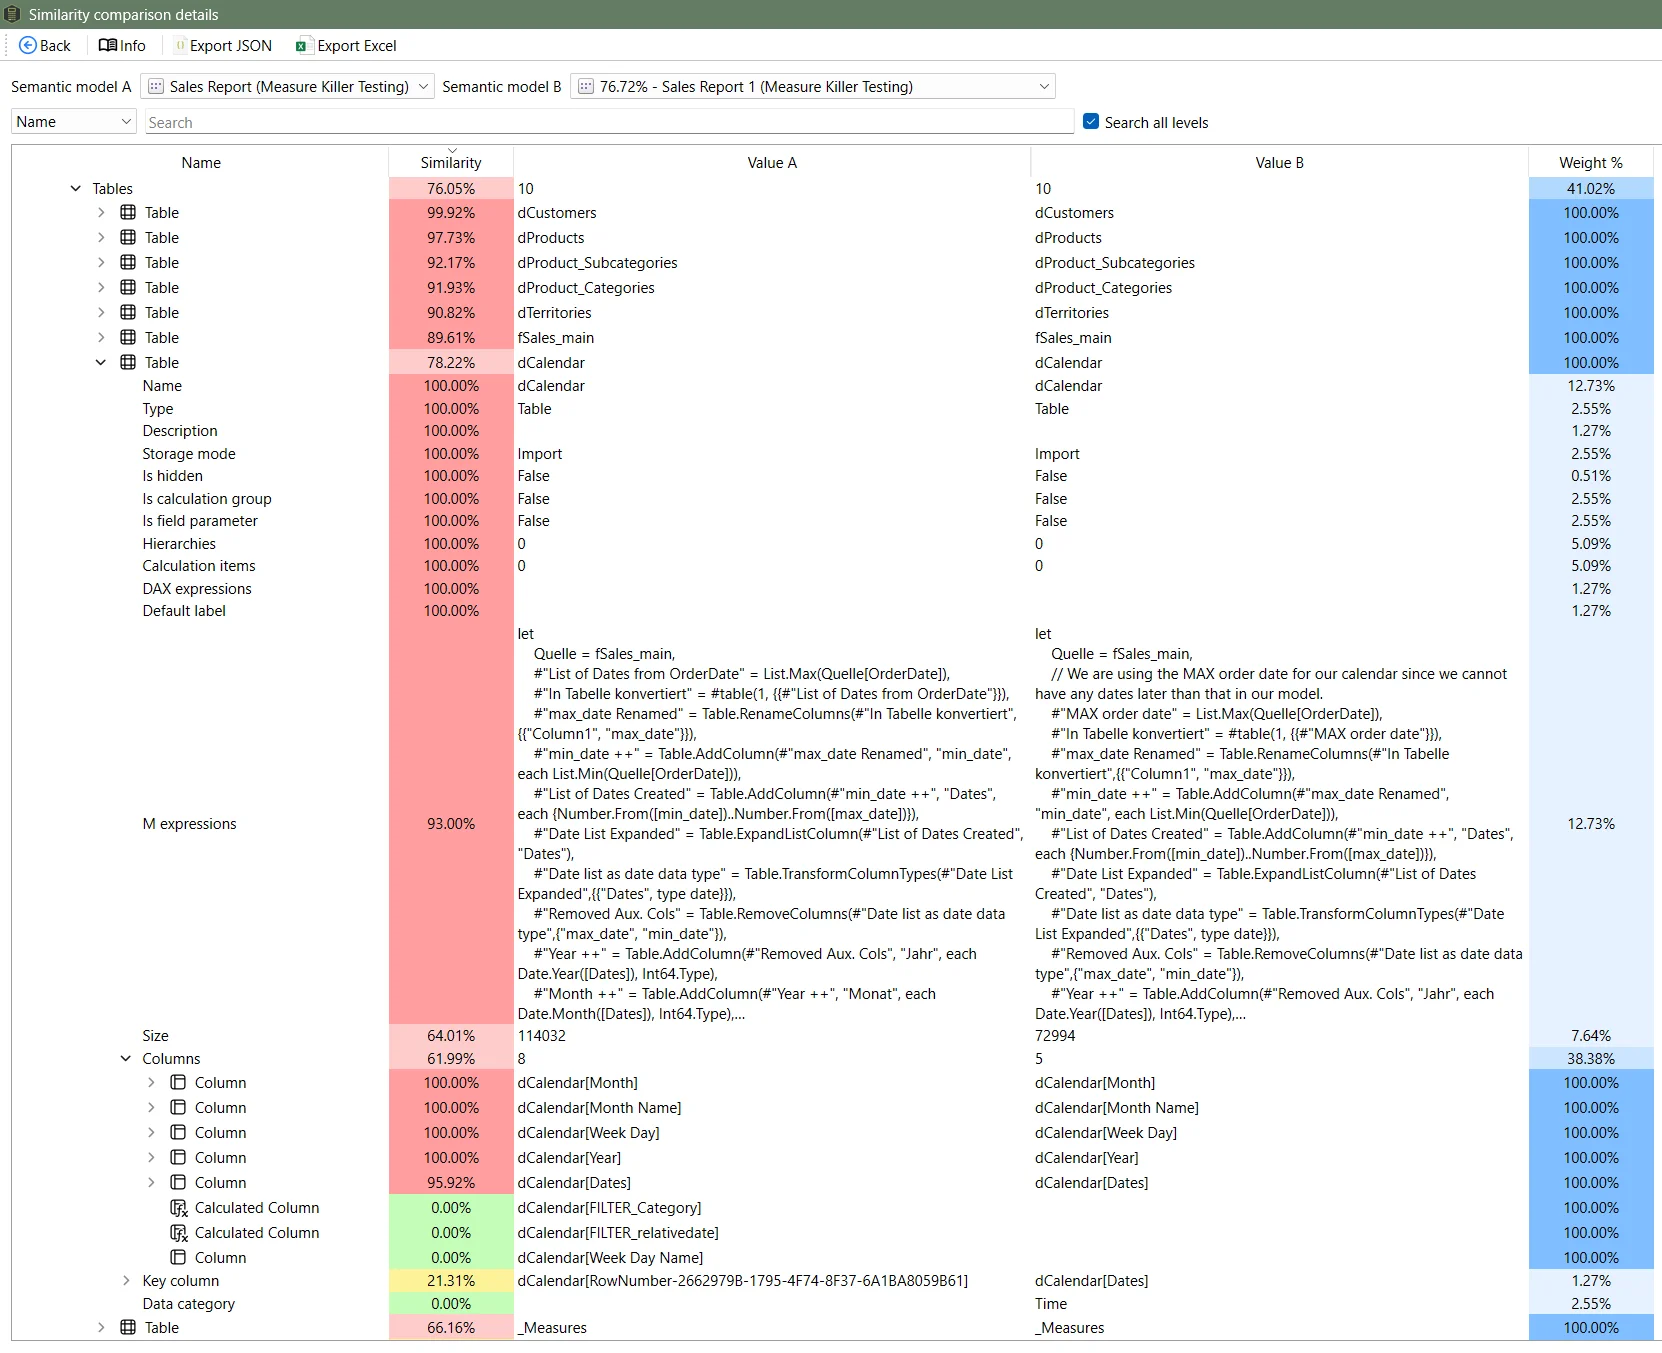
When comparing to a different model, you can see differences for tables and columns.
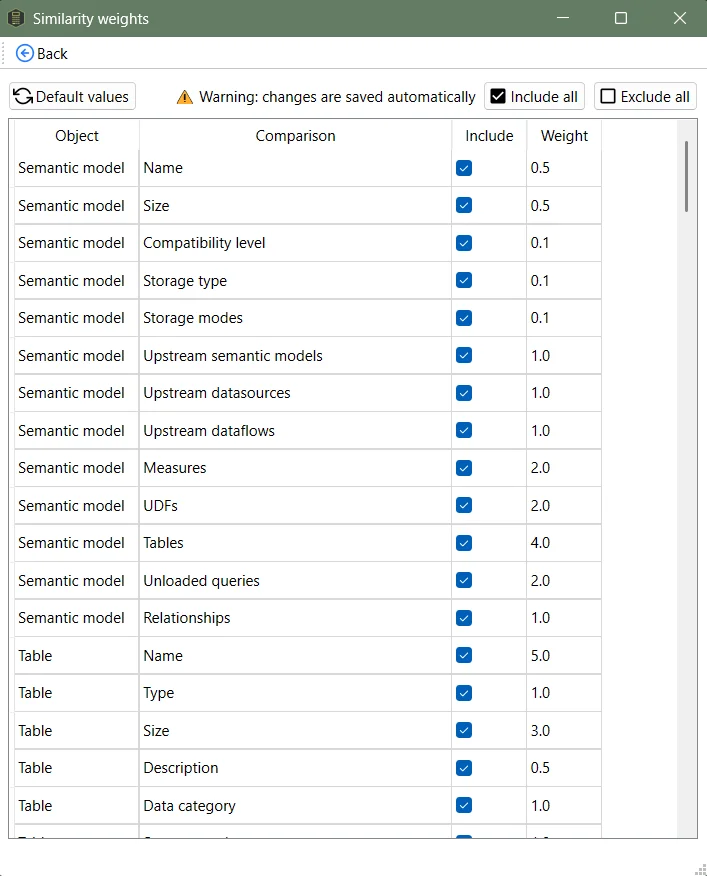
Customizing weights
To change the weights used to calculate the similarity score, or to choose only some parts to compare, click Adjust weights:
Common workflows
- Find consolidation candidates before a model-governance review. Run a tenant scan, open Model Similarity, and sort by score descending. Anything above 80% is worth investigating.
- Spot copy-paste-and-edit drift across departments. When teams fork a model and modify it independently, similarity gradually drops. Comparing the two at regular intervals reveals how far they’ve drifted.
- Validate after a migration. After consolidating two models into one, re-run similarity to confirm the merged model covers everything the originals did.
Related
- Report similarity — the companion view that scores Power BI report similarity
- Run a tenant scan — prerequisite for model similarity
- End-to-end data lineage in Power BI — trace columns and measures from source to visual