Identify Excel users & external XMLA connections
List every Excel user and external XMLA app connecting to your Power BI semantic models — via the activity-logs scan, with workspace and last-access date.
Last updated · May 29, 2026
What you get
A grouped list of every user who has connected to your Power BI semantic models through Excel (Analyze in Excel, pivot tables) or through external applications that query the XMLA endpoint (DAX Studio, Tabular Editor, Measure Killer, custom .NET or Python apps, etc.) — with the workspace, number of activities, and last access date.
Note: Measure Killer can only track Excel and external XMLA connections — it cannot see usage from other Microsoft tools (e.g. Power BI Desktop connecting to a shared model) through the activity logs.
The view drills down from model → user → session (e.g. “Refreshing Excel sheet”, “Creating Analyze in Excel file”, “ExecuteQuery via XMLA”) so you can see exactly what each user is doing.
Where to run it
Activity logs are available in any admin mode — run it from Tenant Analysis for the broadest coverage across every model in the tenant.
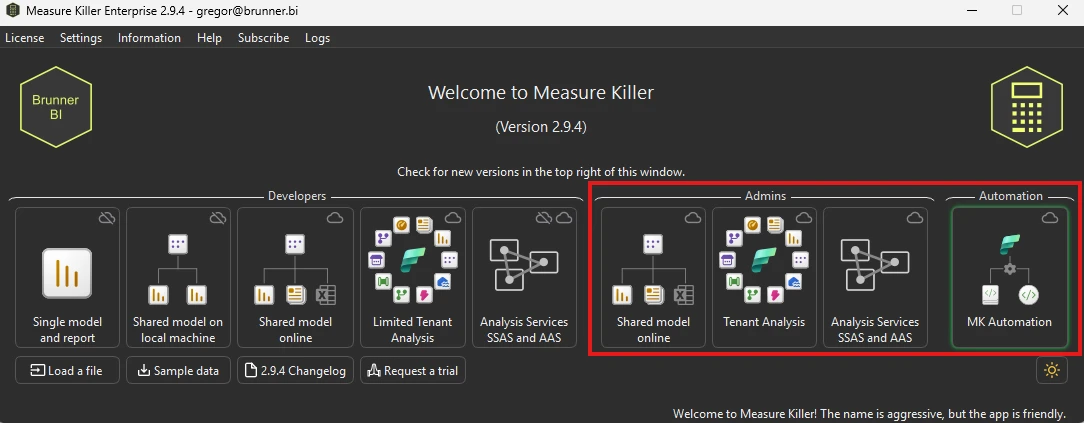
The same activity-log scan runs in:
- Tenant Analysis — scan activity across every model in the tenant in one pass (recommended)
- Shared model online — activity for a single shared model
- MK Automation — unattended, scheduled runs
Why you need an admin
The data comes from the Power BI / Fabric activity log API, which only returns results to a Fabric Administrator or Power Platform Administrator. The log has a 28-day window — anything older than that is no longer queryable.
Build a history beyond 28 days
Every time you fetch activity logs, Measure Killer automatically
appends what it pulled to a local SQLite database in your
%APPDATA% folder. Run the scan every so often (weekly or monthly
works well) and your local store grows past the 28-day API ceiling —
you end up with months or years of history that Microsoft no longer
returns.
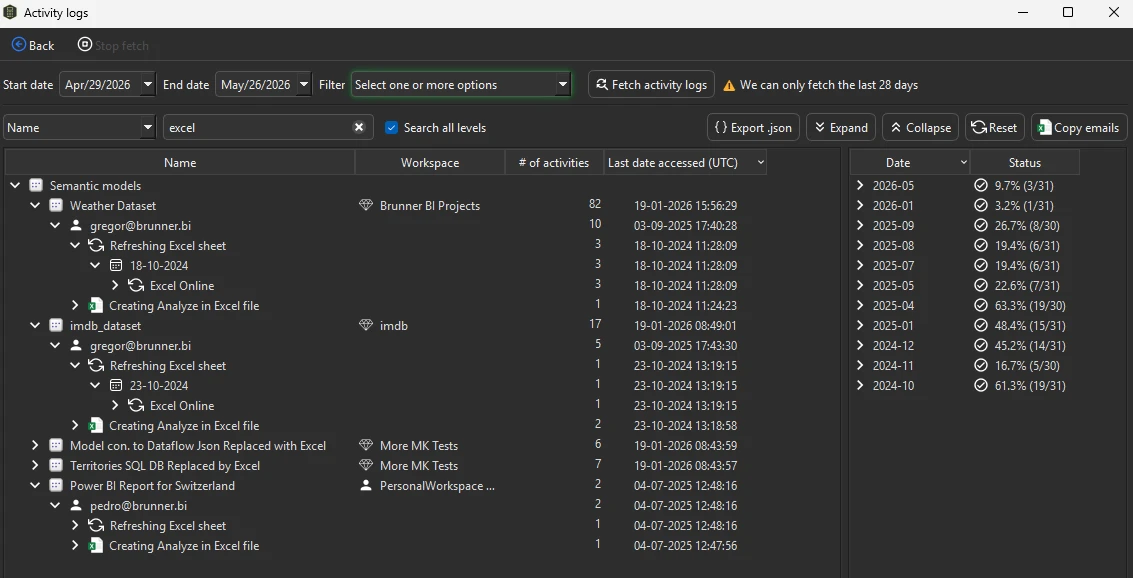
This happens automatically — the history panel on the right side of the Activity logs window shows every month Measure Killer has accumulated data for (as visible in the screenshot above, with activities going back to late 2024). Each month shows the percentage of days with activity, giving you a long-term usage trend per model.
The same SQLite database also stores historical data for capacity metrics and report opens, page views, and average load times — so those numbers accumulate across scans too, not just activity logs. See Report views & opens for the full breakdown of page-level consumption data.
The next scan transparently merges fresh API results with what’s already there — no extra setup required. (For unattended history collection, the same logic runs on a schedule in MK Automation.)
Run the scan
- Open Measure Killer in an admin mode (see screenshot above) — Tenant Analysis is recommended for full coverage.
- Sign in with a Fabric Admin / Power Platform Admin account.
- Click Activity logs in the toolbar.
- The Start date and End date default to the last 28 days — you can leave them as-is or narrow the range.
- Select which activity types to fetch. You can choose to pull only specific categories — e.g. only Excel activities, or only connection activities. Fetching fewer types speeds up the scan significantly on large tenants.
- Click Fetch activity logs.
- Once the tree populates, search for
excelin the search bar to filter down to Excel-related sessions only.
The tree populates with every semantic model that had activity in the window, expandable into the users who touched it and the sessions they ran.
Read the results
Each leaf row shows:
- Name — the session label (e.g. “Refreshing Excel sheet”, “Creating Analyze in Excel file”), or a user identity at the next level up.
- Workspace — where the model lives.
- # of activities — how many distinct events were logged for that user against that model in the window.
- Last date accessed (UTC) — when they last connected.
- Status — a small bar showing the % of days in the window with
activity (e.g.
26.7% (8/30)= active on 8 of the 30 days you queried).
Use Export .json to hand the list to a stakeholder, or Copy emails to build a distribution list of the users you’ve just identified.
Common workflows
Excel users — include their files in your used/unused analysis
The main use case: before cleaning up a semantic model, you need to know which columns and measures are consumed by Excel workbooks — not just by Power BI reports.
- Identify the Excel users via the activity logs (this page).
- Collect the actual
.xlsxfiles from those users. This is the main catch — Measure Killer cannot access Excel files automatically, because they typically live on a user’s local machine or in a personal OneDrive. You need to ask the users to share them, or have a tenant admin pull them from a managed SharePoint / OneDrive location. - Drag and drop the Excel files into Measure Killer’s analysis window. They appear in the dependency tree alongside Power BI reports, so columns flagged as “unused” truly are unused — not “unused in reports but pulled into someone’s pivot table”.
See Find what your Excel users are consuming for the full walkthrough of step 2 and 3.
External application connections (XMLA endpoint)
The activity logs also surface connections from external applications that pull data via the XMLA endpoint — DAX Studio, Tabular Editor, Measure Killer itself, custom .NET or Python apps, and any other XMLA client. This only covers external (non-Microsoft) tools; connections from Microsoft tooling other than Excel are not visible in the activity logs. This helps you:
- Audit who is querying models directly — find users running ad-hoc DAX or MDX queries from external tools.
- Spot automation and ETL — service accounts or apps pulling data from semantic models on a schedule.
- Right-size permissions — see who actually uses their XMLA access vs. who has it but never connects.
Inventory before a model rewrite
Before changing column names, removing measures, or restructuring a model, check the activity logs to confirm who’s pulling from it — in Excel or via external XMLA applications. Combine with the used/unused analysis to get the full picture.
Audit shadow BI
Find Excel users who bypass the official reports and query the model directly. Measure how much business analysis lives in Excel rather than in governed reports, then decide whether to migrate it.
Related
- Find what your Excel users are consuming from your semantic model — the next step: add their files to see which columns and measures they use
- Run a tenant-wide scan — the recommended way to run activity logs across the entire tenant
- Find and remove unused measures and columns — the cleanup step that factors in Excel consumption
- Access & permissions tracking — who has access vs. who actually connects