Table relations
See every way one table can filter another — active, inactive, and via intermediate tables. Essential for debugging filter context in complex models.
Last updated · June 19, 2026
What it does
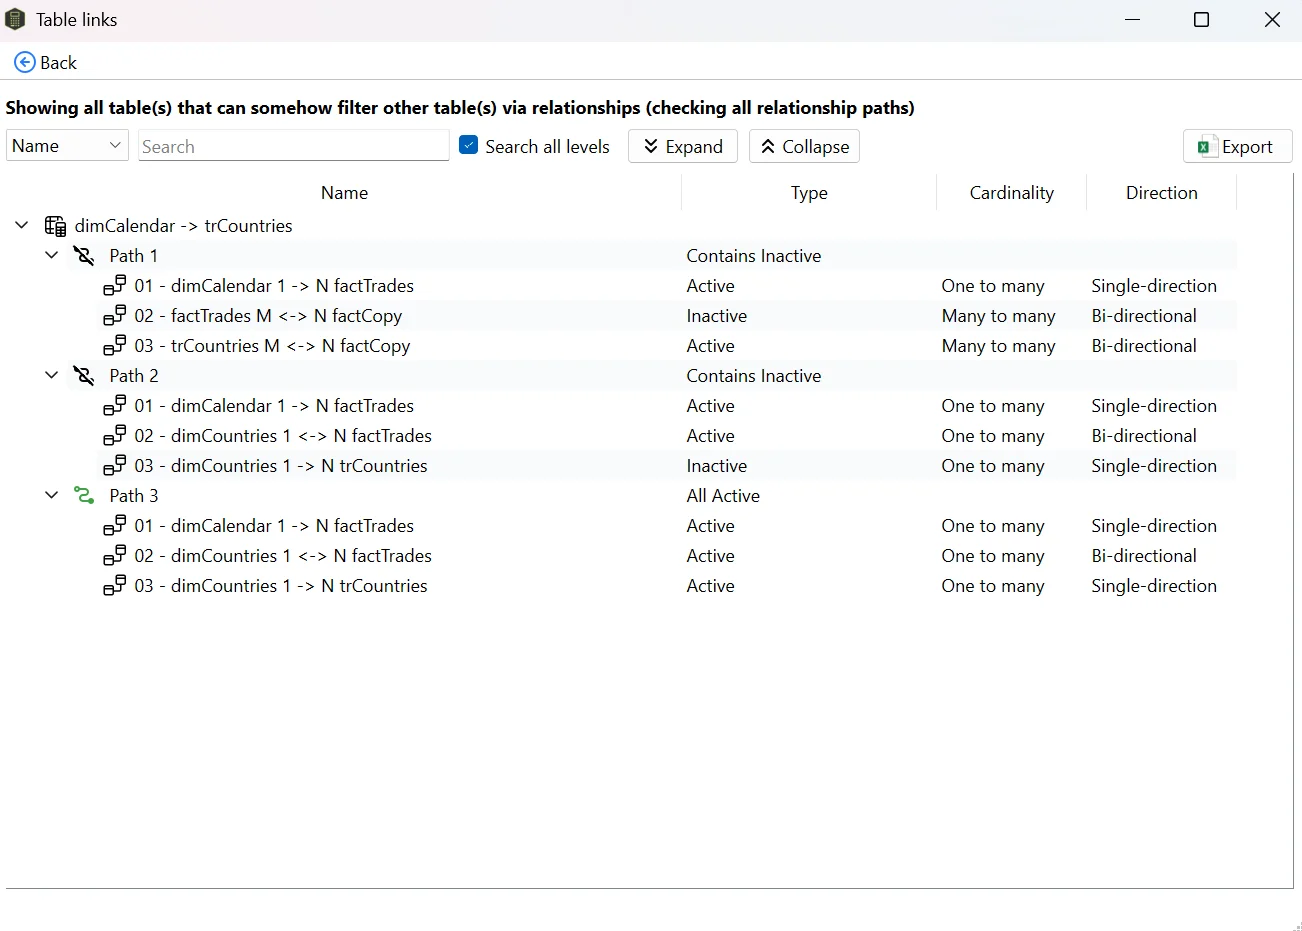
Table Relations shows you every path through which one table can filter another in your semantic model. For each path, you see:
- Every relationship in the chain (from source to target)
- The direction of each relationship (one-to-many, many-to-one, many-to-many)
- The cross-filter direction (single, both)
- Whether each relationship is active or inactive
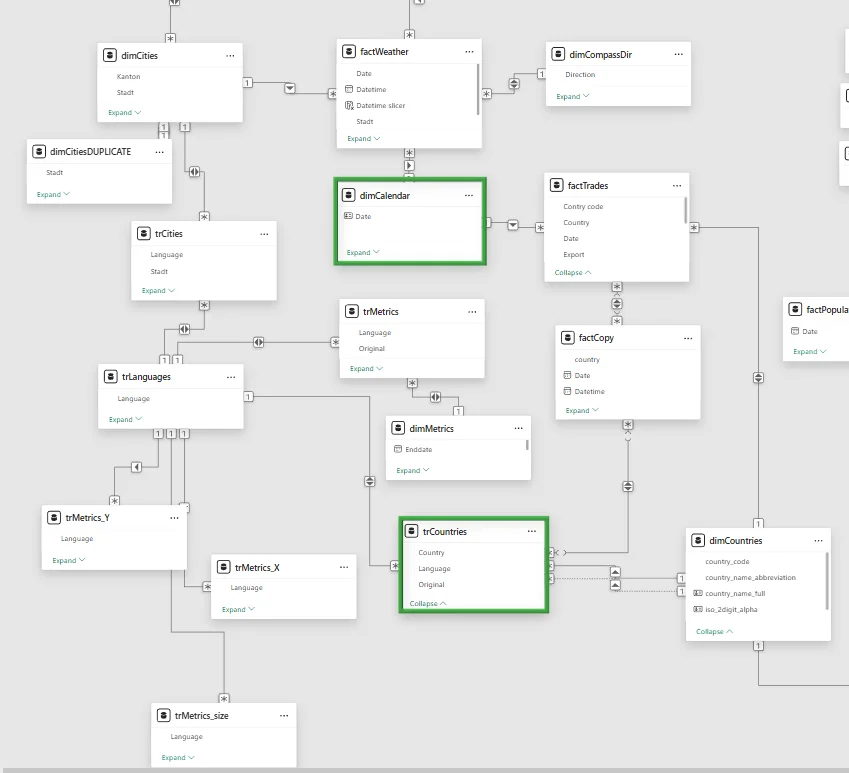
This is especially useful in complex models with many tables, bi-directional relationships, and auto-detected relationships where manual tracing is impractical.
When to use it
- Debugging unexpected filter behavior. A slicer on one table is filtering (or not filtering) a visual on another table in a way you don’t expect. Table Relations shows you exactly which relationship chain is causing it.
- Understanding USERELATIONSHIP effects. Before writing a
USERELATIONSHIPcall, check which inactive paths exist between two tables — and what activating one would do to filter propagation. - Auditing a model you didn’t build. When you inherit a model with dozens of tables and complex relationships, Table Relations gives you an instant map of how filters flow — faster than tracing arrows in the Model view.
- Spotting ambiguous filter paths. If two active paths reach the same table through different chains, you have ambiguous filter propagation that can produce incorrect results. Table Relations surfaces these immediately.
How to use it
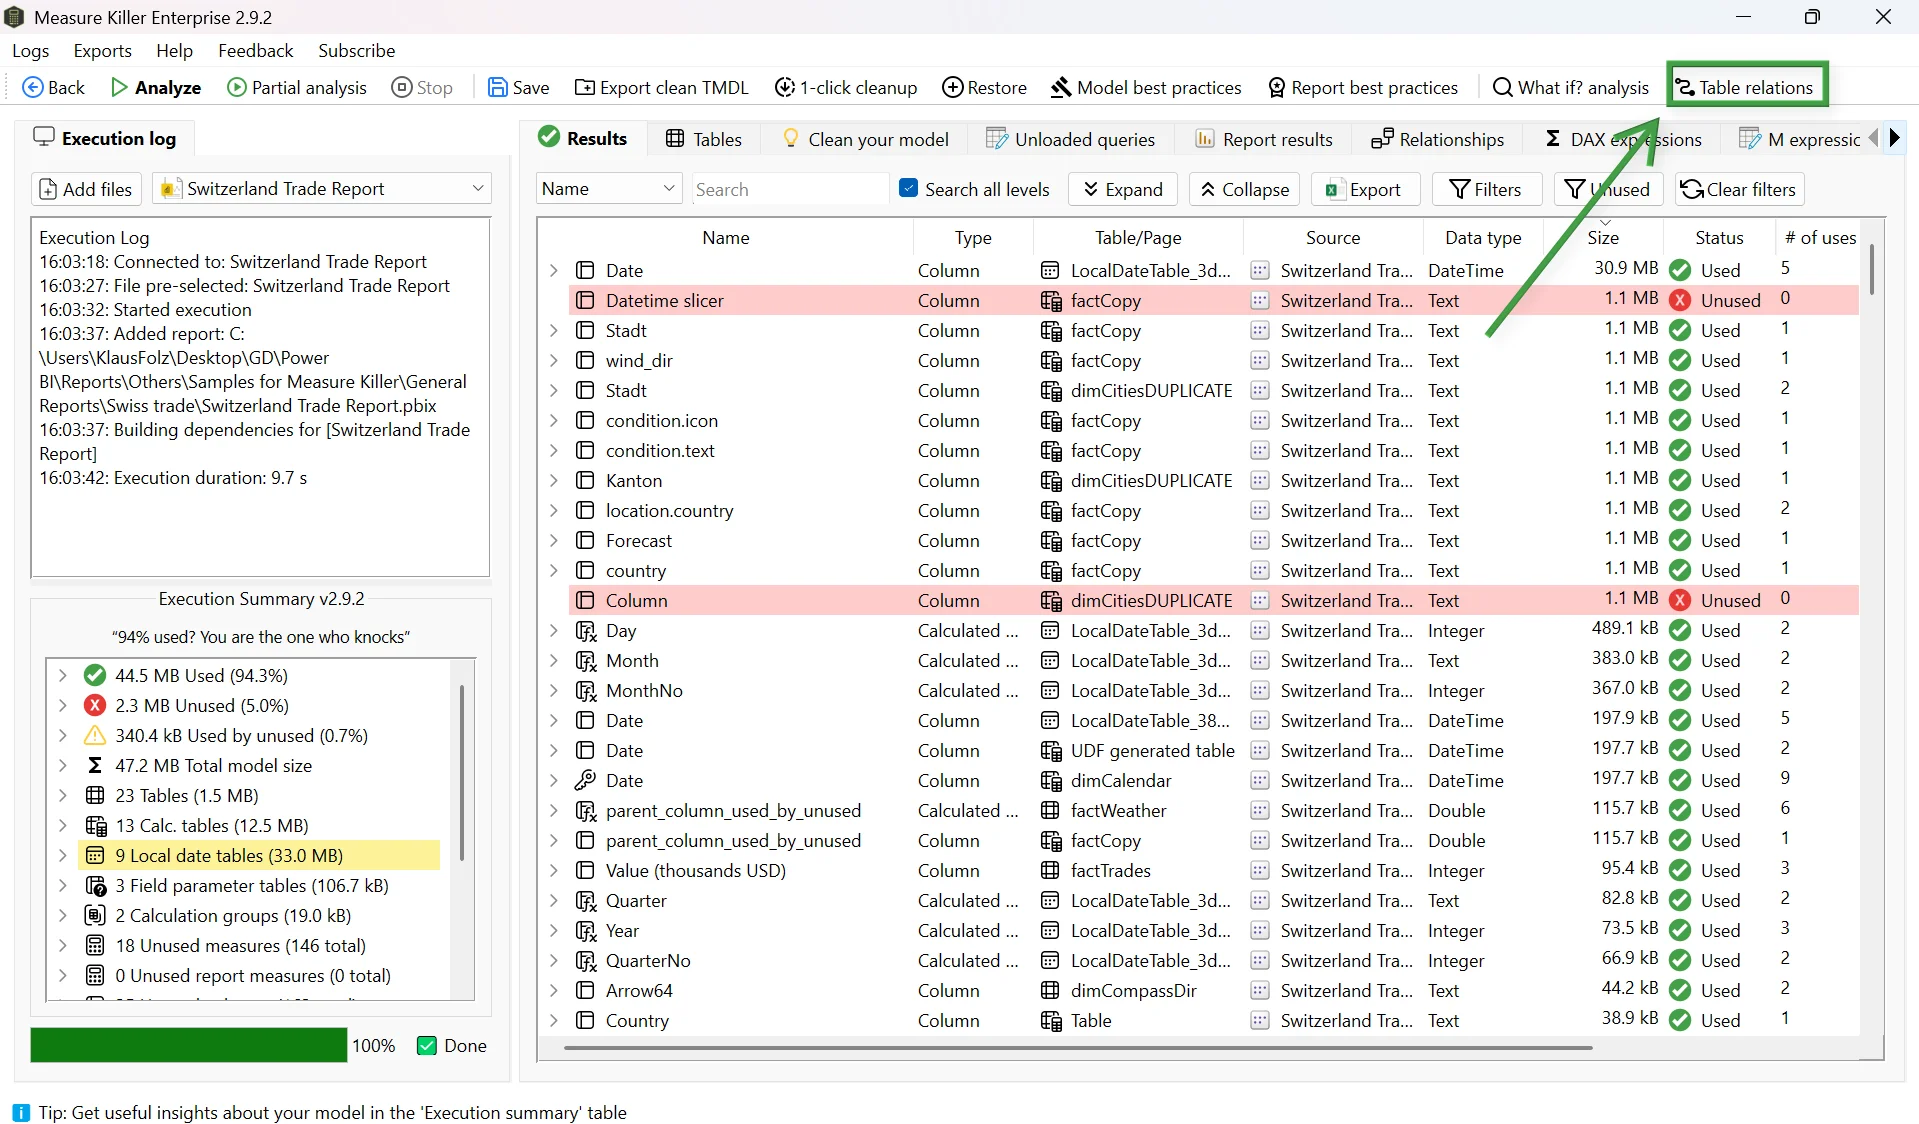
- Run an analysis in Measure Killer (any mode — desktop, online, or tenant analysis).
- Click Table Relations in the toolbar.
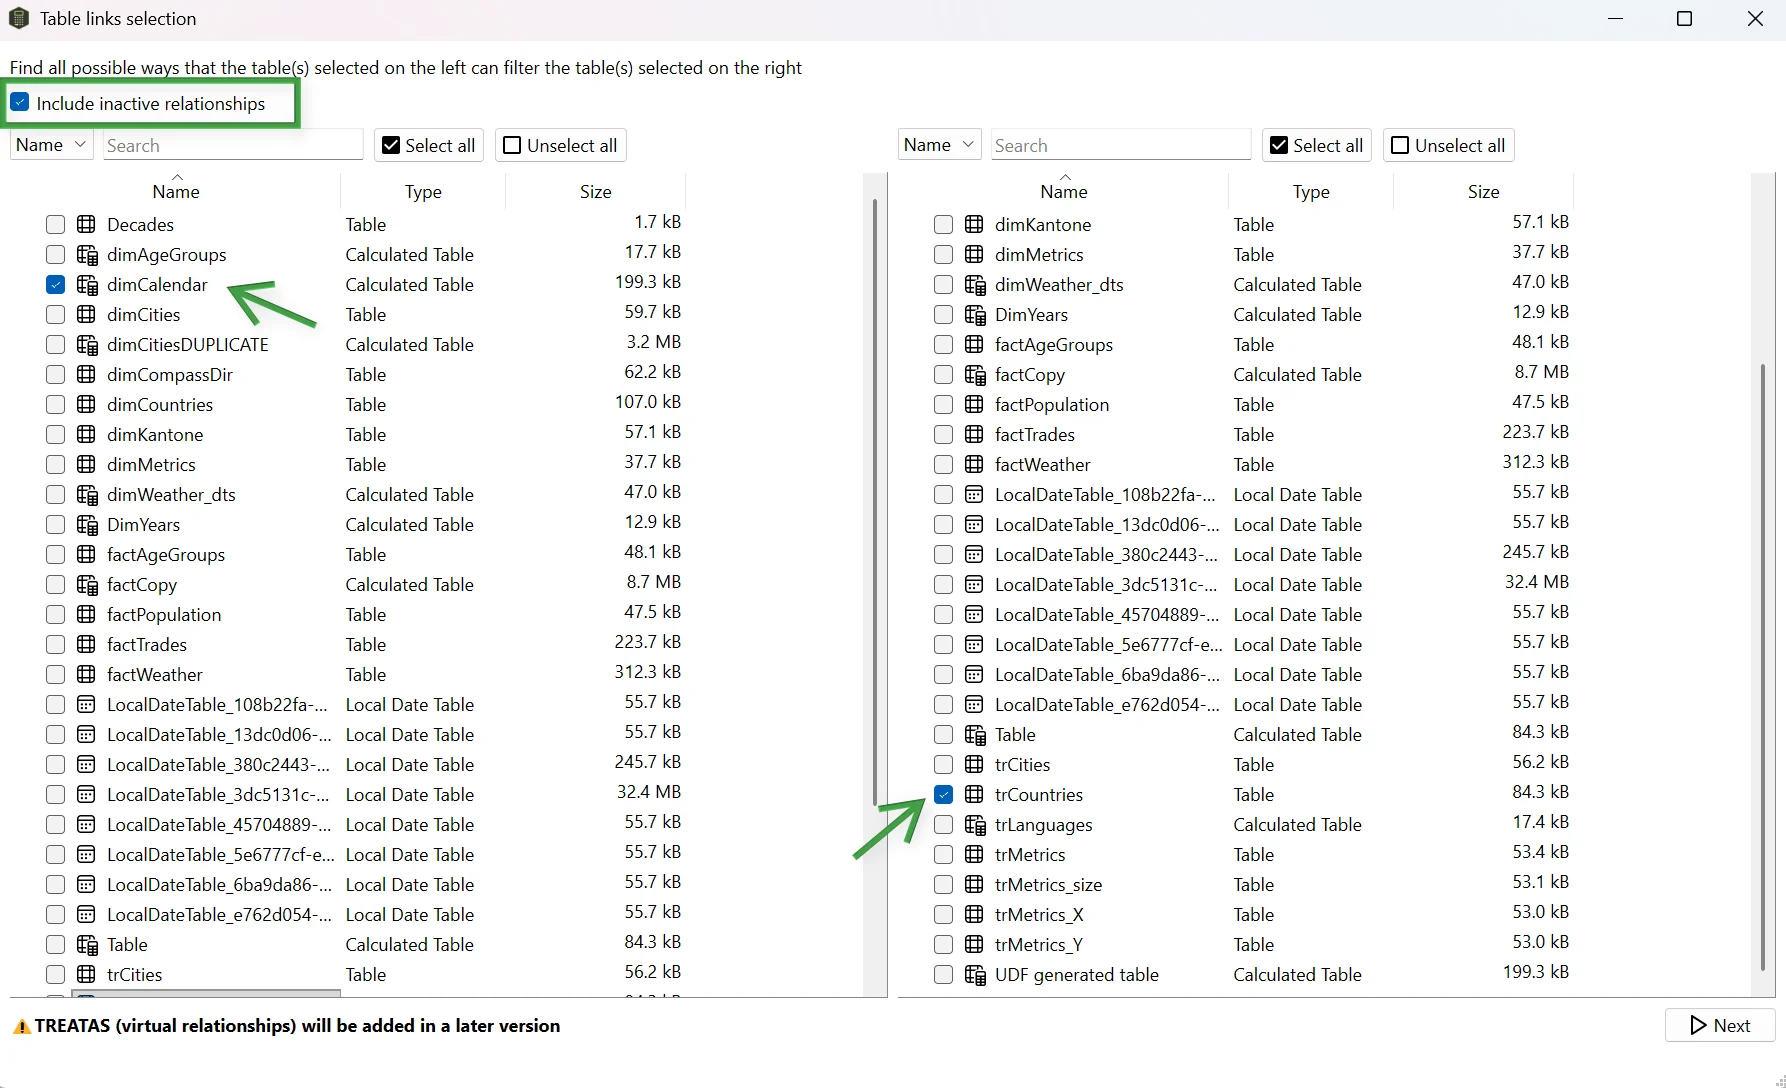
- Select the source table on the left — this is the table whose filter you want to trace.
- Select the target table on the right — this is the table you want to check is affected.
- Click Next.
Measure Killer displays every valid path between the two tables.
Direction matters
The left-side table is the filter source: “how can this table filter the right-side table?” Swapping the tables may give different results depending on relationship cross-filter directions and cardinality.
Include inactive relationships
Check the Include inactive relationships option (top-left) to see
paths that go through inactive relationships. These paths don’t
propagate filters by default but can be activated with
USERELATIONSHIP in DAX.
Multi-select
You can select multiple tables on either side for a comprehensive overview of filter paths across the model. This is useful for getting a full picture of how a dimension table reaches every fact table, for example.
What to do with the findings
- Remove unused inactive relationships. If an inactive
relationship is never activated by any
USERELATIONSHIPcall (check with the DAX expressions search), it can be safely removed to simplify the model. - Fix ambiguous active paths. If two active paths reach the same
table, consider deactivating one and using
USERELATIONSHIPexplicitly when needed. - Simplify bi-directional relationships. If a bi-directional
relationship exists only because of a specific filter requirement,
consider replacing it with a single-direction relationship plus a
CROSSFILTERcall in the measures that need it.
Related
- How to find all ways that a table can filter another table — blog post with walkthrough and screenshots
- Best-practice analysis — catches bi-directional and many-to-many relationship anti-patterns
- Dependency tree — visualize how measures and columns depend on each other
- Find and remove unused measures and columns — the broader cleanup workflow