 Measure Killer
Power BI lineage in Databricks Unity Catalog
Push Power BI and Fabric lineage into Databricks Unity Catalog as external lineage — see dataflows, semantic models, reports, pages and visuals downstream of a UC table, with column-level relationships.
Last updated · October 15, 2026
The first Measure Killer catalog integration
Databricks Unity Catalog is the first external catalog Measure Killer writes Power BI lineage into. It runs from MK Automation and is available today. The same lineage also goes into Snowflake and, in the open OpenLineage format, into any tool that supports it at column level.
Talk to us about setting it up →What you get
Unity Catalog tracks everything inside your lakehouse. It sees
samples.bakehouse.sales_transactions and every notebook and job that
reads it, but it does not capture Power BI lineage on its own. Its
external lineage
feature lets you add Power BI to the graph, but you register each Power
BI asset and each of its relationships yourself, in Catalog Explorer or
through the REST API.
Measure Killer does that for your whole estate, automatically. It takes the Power BI and Fabric graph it already builds during a tenant scan and writes it into Unity Catalog as external lineage, at full depth. It starts at the Databricks tables your reports read and ends at the individual visuals that display them, at column level, following every hop a column takes on the way:
- Dataflows. Gen1 and Gen2 dataflows that load a Databricks table, including dataflows that read from other dataflows.
- Power Query. The transformations a column goes through, in a dataflow or in the semantic model: renamed, merged with another column, or used to derive a new one. Native SQL passed through Power Query is resolved too.
- Chained semantic models. Models that import from another semantic model or build on it with DirectQuery, so a column is followed from the model that loads it into every model that reuses it.
- DAX. Measures and calculated columns, mapped to the columns they are calculated from.
- Reports, pages and visuals. The reports built on each model, their pages and the individual visuals on them, plus paginated reports and Excel files connected to the model.
The graph then continues straight through into Power BI:
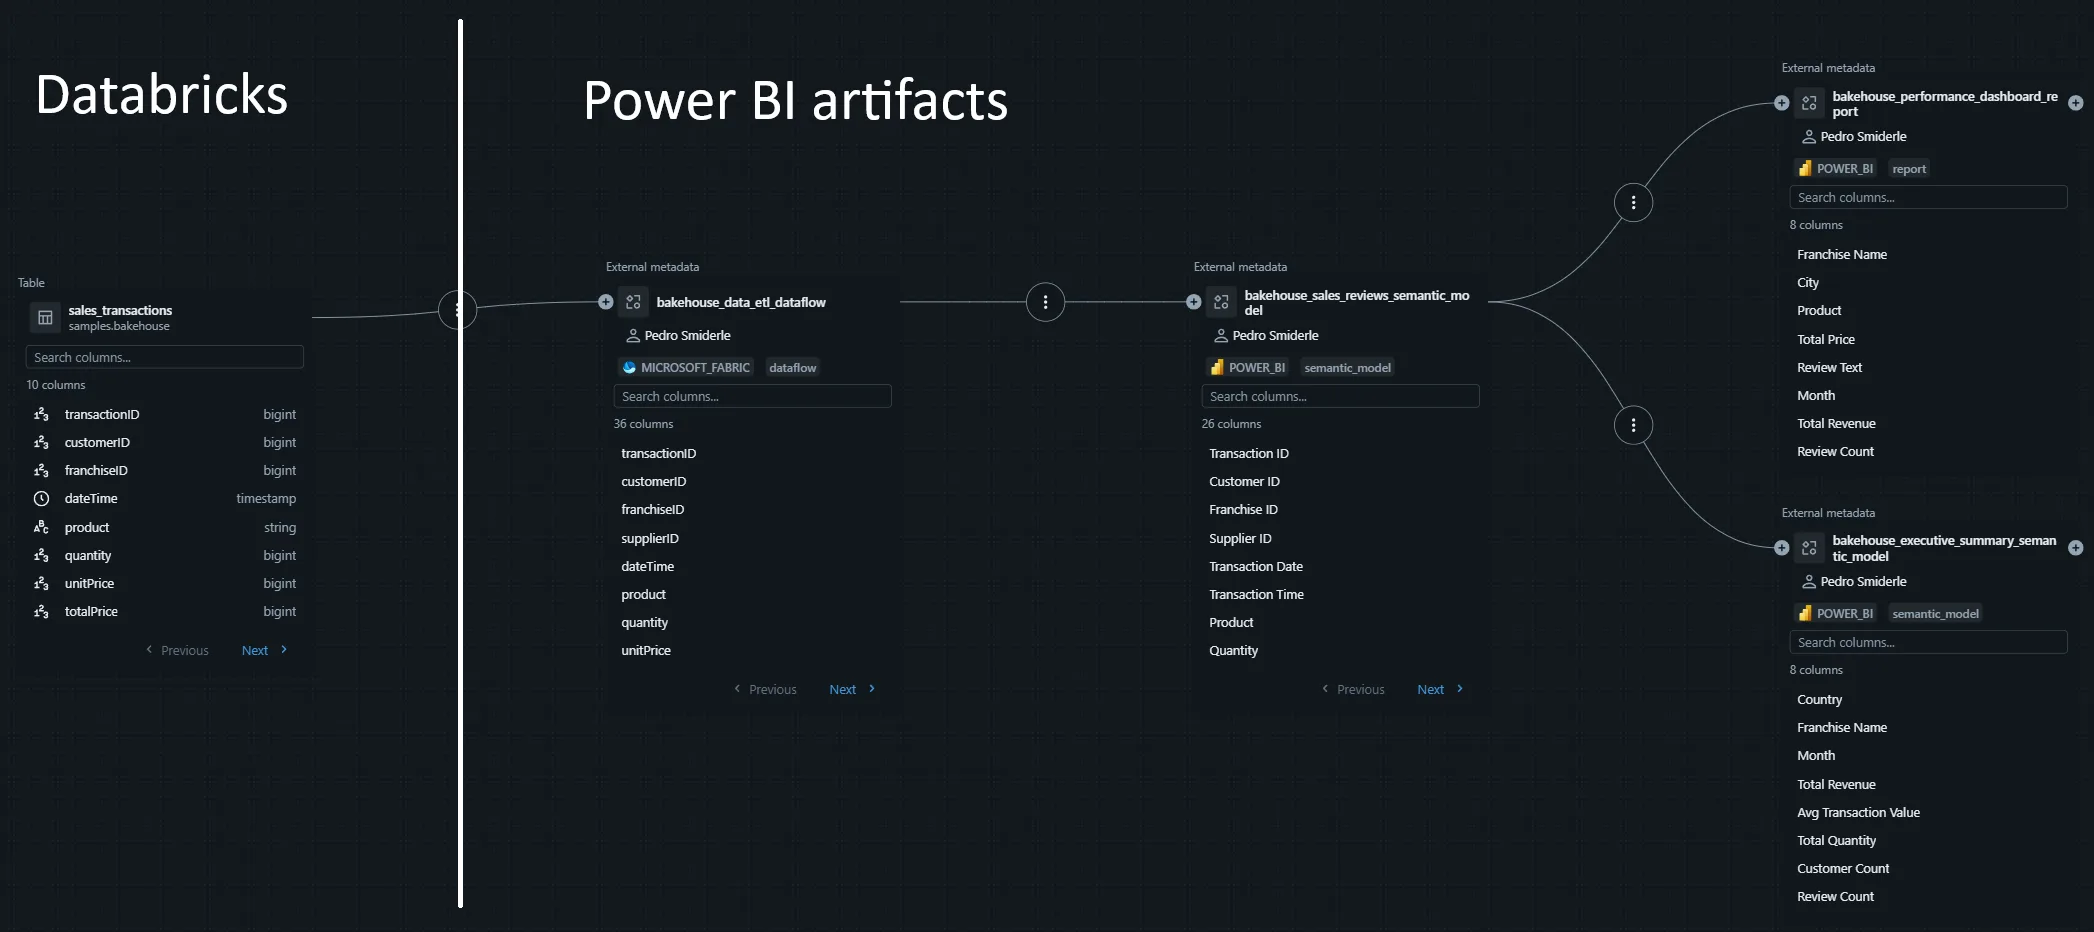
On the left is the Databricks table Unity Catalog already tracked. To the right of the divider is everything Measure Killer contributed: the Fabric dataflow, the semantic models built on it, and the reports that consume them. All of it is inside Databricks, in the native lineage view, with no separate tool to open.
What Measure Killer writes into Unity Catalog
Each Power BI or Fabric item becomes an external metadata object — Unity Catalog’s securable for an entity that lives in another system — tagged with its system and entity type, carrying its owner and its full column list:
| Item | System | Type |
|---|---|---|
| Gen1 / Gen2 dataflow | MICROSOFT_FABRIC | dataflow |
| Semantic model | POWER_BI | semantic_model |
| Power BI report | POWER_BI | report |
| Report page | POWER_BI | report_page |
| Visual | POWER_BI | visual |
| Paginated report | POWER_BI | paginated_report |
| Excel file connected to a model | OTHER | excel_file |
Between those objects — and between them and your Databricks tables — Measure Killer writes lineage relationships, each carrying the individual column relationships that make it up. Open any relationship in Unity Catalog and the detail panel shows both the column mapping and the provenance properties Measure Killer stamps on everything it creates:
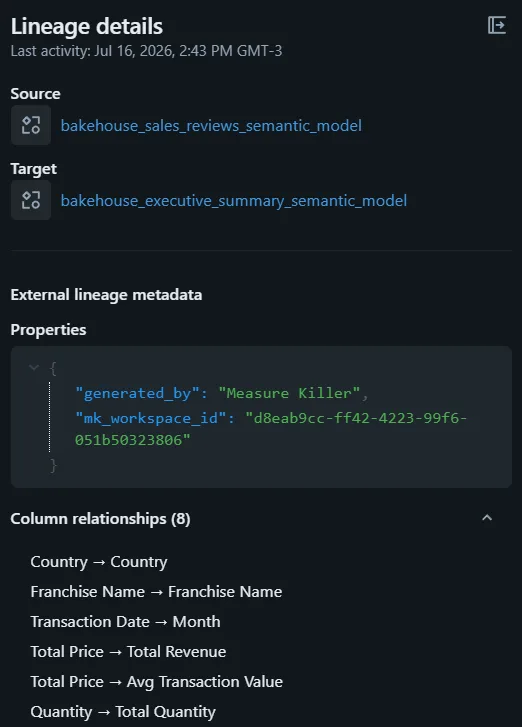
Every object and relationship carries "generated_by": "Measure Killer" and the
mk_workspace_id it came from. That makes the contribution auditable
and, just as importantly, reversible — you can always tell Measure
Killer’s objects apart from lineage Databricks captured itself.
Note the column relationships in that panel: Total Price → Total Revenue, Transaction Date → Month, Quantity → Total Quantity. These
are aggregations and transformations defined inside the semantic
model, in DAX and Power Query. Resolving them deterministically, one
column mapping at a time, is what Measure Killer’s
reference detection does.
Following one column
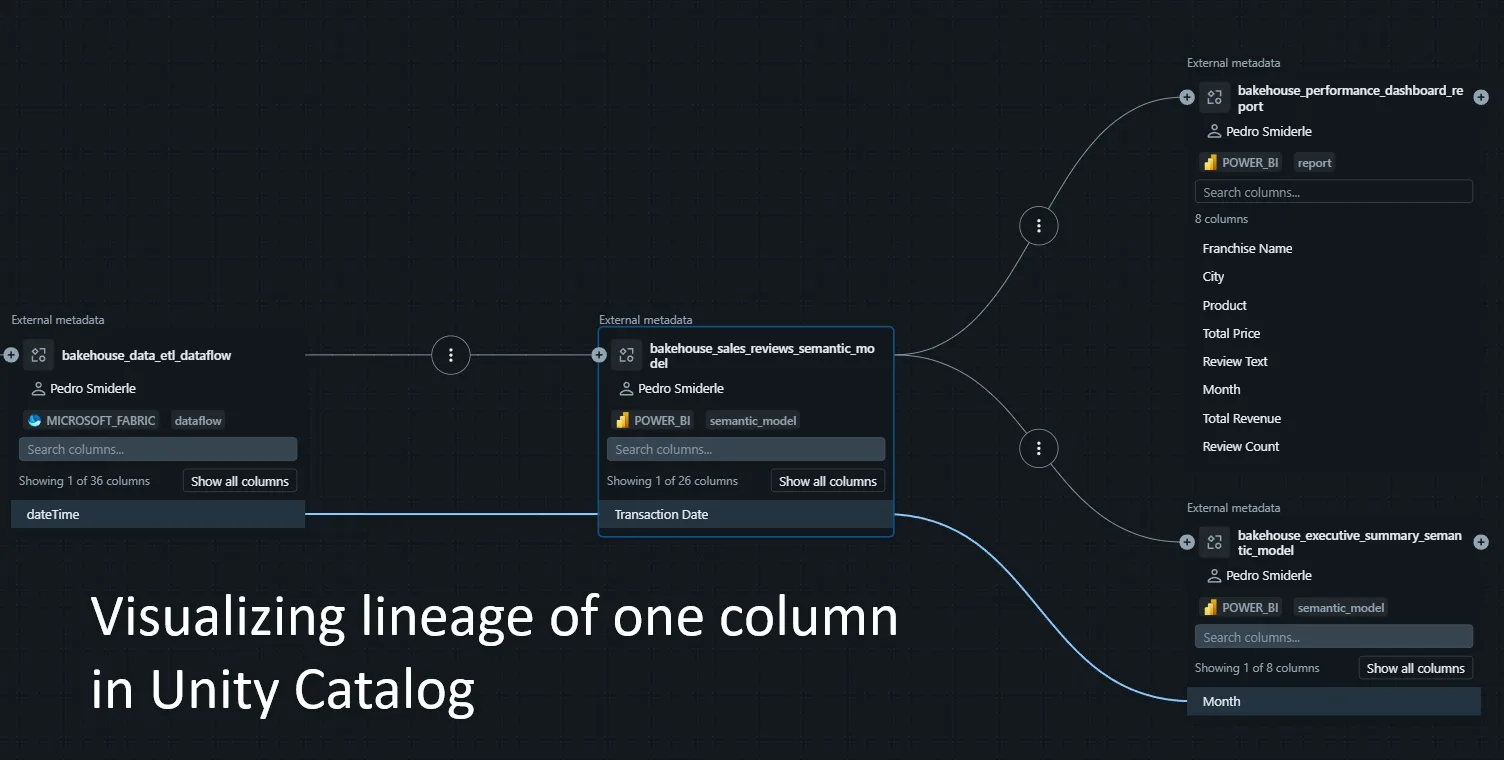
The point of writing lineage at column grain is that you can select a
single column and see only what it touches. Pick dateTime on the
Databricks table and Unity Catalog highlights where it goes — into the
dataflow, and on into Transaction Date and Month on the semantic
models:
A Unity Catalog display limitation to be aware of
Unity Catalog renders column-level flow one hop at a time. Selecting a column shows its relationships to the entity immediately upstream and the entity immediately downstream — it does not chain those hops together into a single highlighted path across the whole graph. To follow a column from a Databricks table down to a visual you currently have to walk it hop by hop, re-selecting at each entity. This is a limitation of how Unity Catalog displays lineage, not of the data Measure Killer writes: the full multi-hop column chain is present in the relationships pushed into the catalog.
The complete column path, resolved in one view, is what Measure Killer itself shows — see source-to-visual lineage. The Unity Catalog integration is about making that graph visible to people who work in Databricks, not about replacing the view where the end-to-end trace reads best.
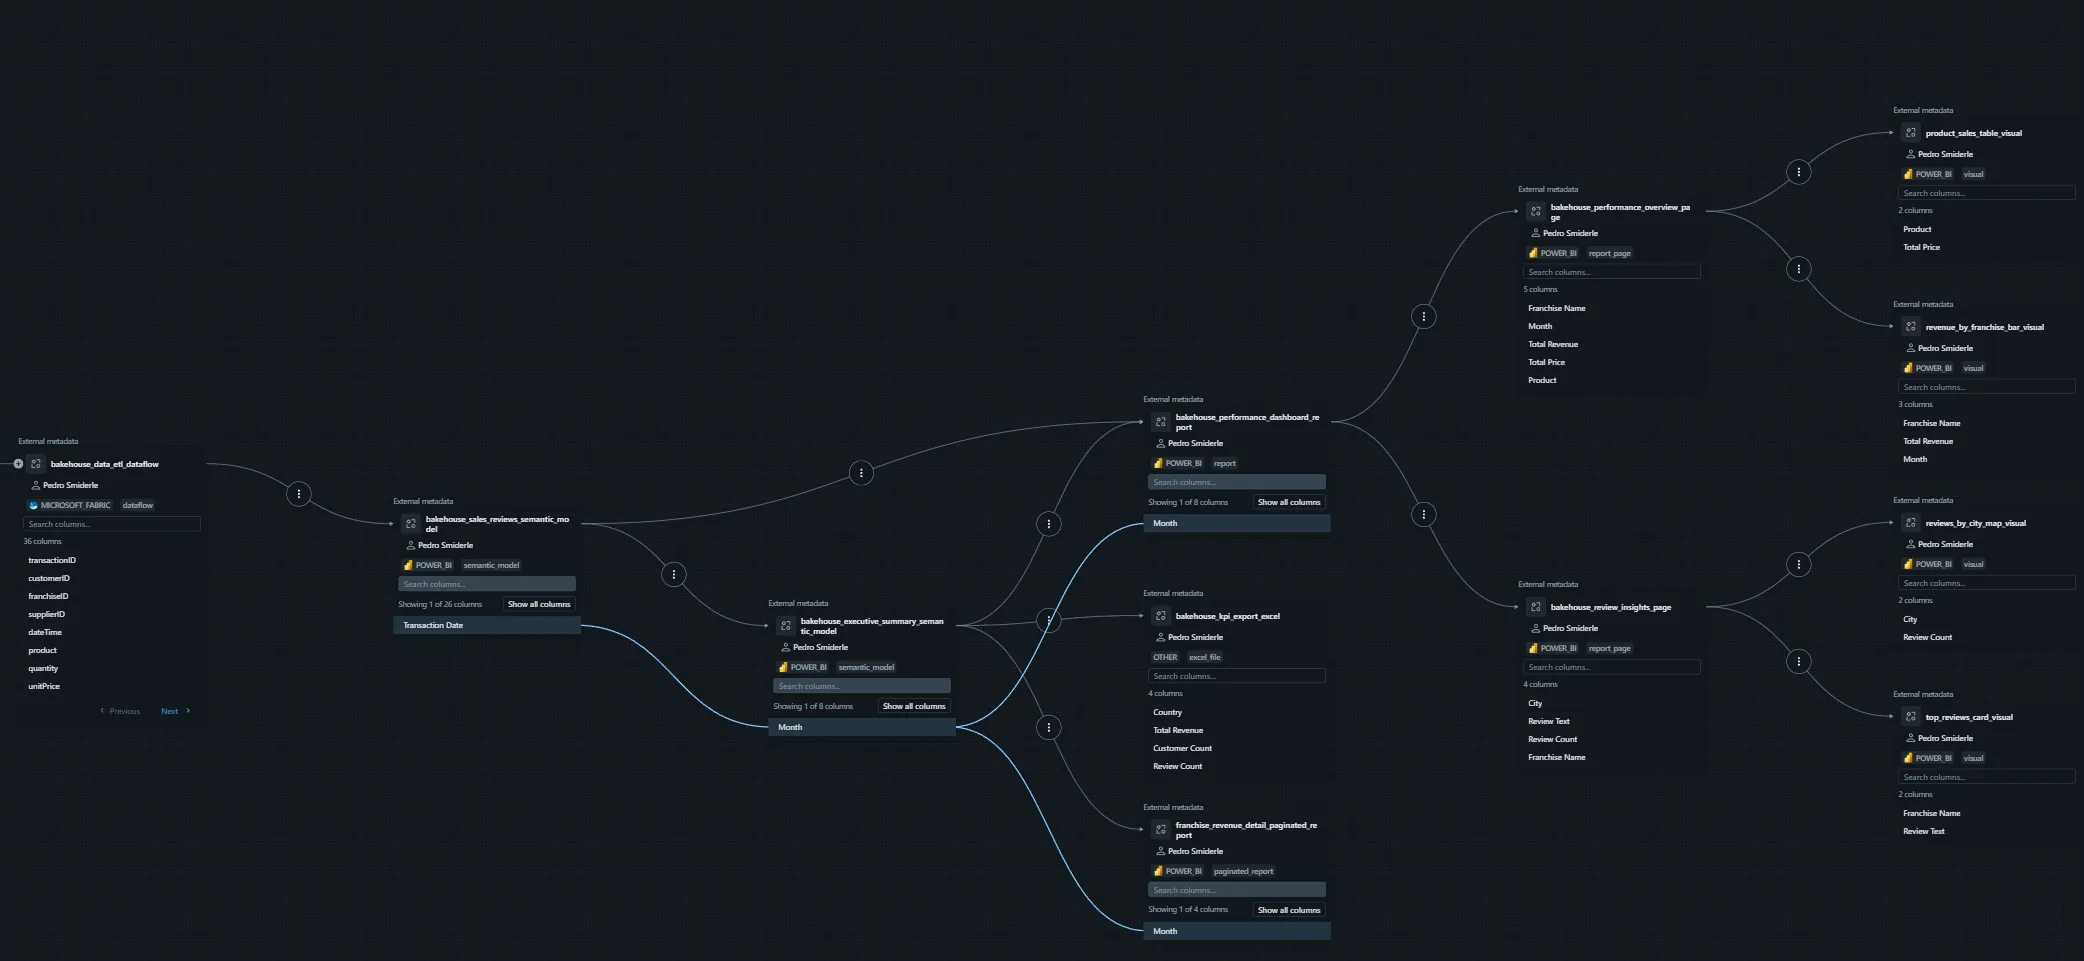
Expanded fully, the object-level graph does run from the Databricks table all the way to individual visuals — report pages, the visuals on them, a paginated report, and an Excel export, each as its own node:
How to run it
The integration runs from MK Automation, not the desktop app, because it is meant to run on a schedule and keep the catalog current:
- Scan the tenant. The automation job runs a tenant scan as it normally would, building the lineage graph across your Power BI and Fabric estate.
- Point it at your metastore. Supply the Databricks workspace URL
and a service principal or PAT holding
CREATE EXTERNAL METADATAon the metastore. - Push. Measure Killer maps the Power BI graph onto Unity Catalog’s external metadata objects and lineage relationships, matching Databricks tables to the Power BI items that consume them.
- Schedule it. Re-run on the same cadence as your scan — daily or weekly is typical. Each run reconciles against what it wrote previously, so renamed and deleted items don’t leave orphans behind.
Who this is for
- Databricks-first data platforms. If Unity Catalog is your system of record for governance, this is how Power BI stops being a blind spot in it — without asking your Databricks team to learn a second catalog.
- Impact analysis before a table change. Before altering or dropping a UC column, the Databricks lineage graph now answers “which visuals break?”, not just “which notebooks break?”.
- Regulated-data scope. Tag a column as PII in Unity Catalog and the downstream reports and visuals consuming it are visible from the same place — no cross-referencing two catalogs by hand.
- Cost work on the lakehouse side. Columns and tables that reach no Power BI visual anywhere in the tenant are candidates to stop computing.
Related
- Source-to-visual column lineage: the lineage engine behind this integration
- Data lineage in Power BI: what lineage looks like inside Measure Killer today
- Power BI lineage in Snowflake: the same lineage, visible in Snowsight
- Power BI lineage via OpenLineage: the same lineage for any tool that supports column-level OpenLineage
- MK Automation: the scheduled path this integration runs on
- Run a tenant-wide scan: the scan that builds the graph being pushed