 Measure Killer
Analyze and clean up a dataflow
Pick one or more Power BI dataflows (Gen1, Gen2 or Gen2 CI/CD) and see which of their queries and columns are used by downstream semantic models, dataflows and reports, and which can be removed.
Last updated · November 4, 2026
Dataflows tend to grow the same way semantic models do. Someone adds a query for one report, another team builds a second dataflow on top of the first, and after a while nobody can say which columns are still needed. Removing one feels risky, because the consumers are spread across other dataflows, models and reports in other workspaces.
Dataflow Analysis mode starts from the dataflow. Measure Killer finds everything downstream of it, other dataflows, semantic models and reports, and tells you which queries and columns none of them use.
How it works
You pick one or more dataflows (Gen1, Gen2 or Gen2 CI/CD). Measure Killer reads their queries and columns, then fetches every dataflow, semantic model and report that reads from them, and checks which of the dataflow columns they actually use.
That is why the mode needs tenant admin rights for now: the consumers of a dataflow often live in workspaces you are not a member of.
Open the mode
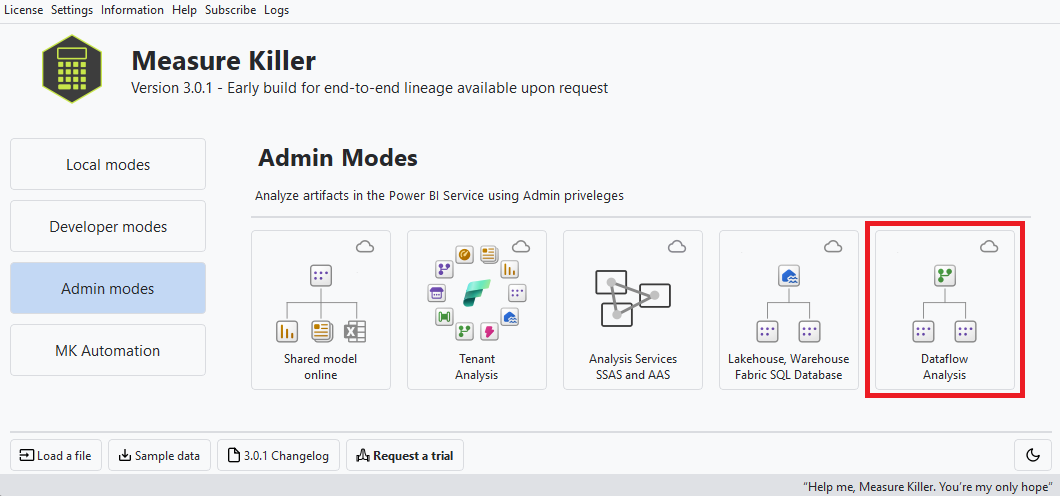
On the welcome screen, open Admin modes and click Dataflow Analysis. The tile under Developer modes still says Coming soon:
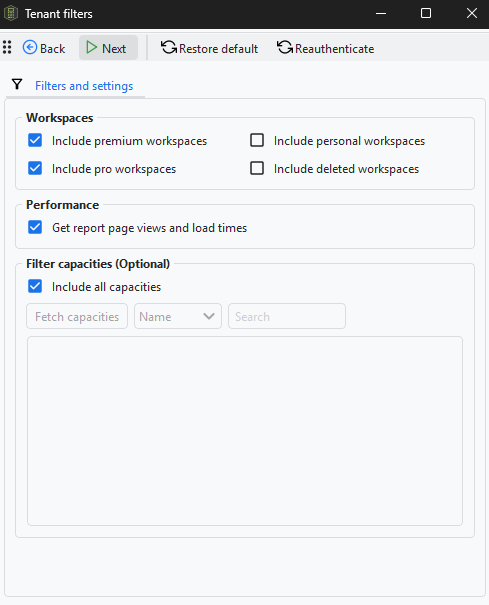
After you sign in with your admin account, the Tenant filters window opens. Choose which workspace types to include (Premium, Pro, personal, deleted), whether to fetch report page views and load times, and optionally limit the search to certain capacities. Then click Next:
Choose where to search
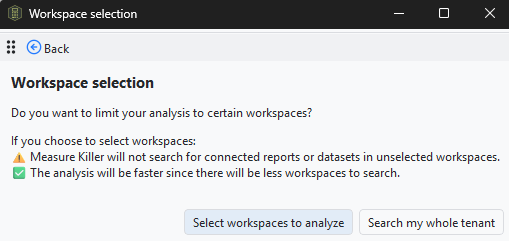
Measure Killer now asks whether you want to limit the analysis to certain workspaces. Search my whole tenant finds every consumer of the dataflow, wherever it lives. Select workspaces to analyze is faster, but Measure Killer will not look for connected reports or semantic models in the workspaces you leave out:
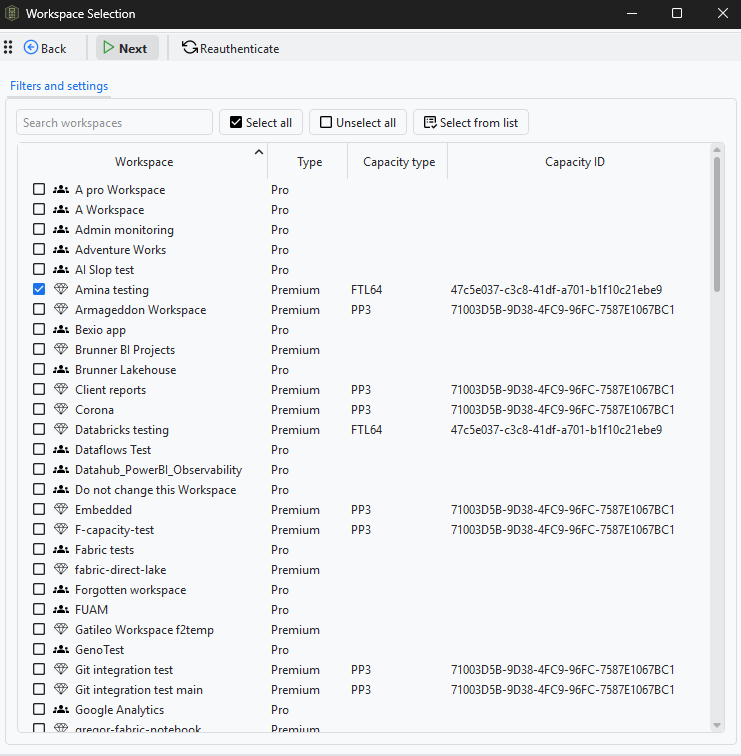
If you chose to select workspaces, tick the ones you want, or use Select from list to paste a list of names, and click Next:
Pick the dataflows
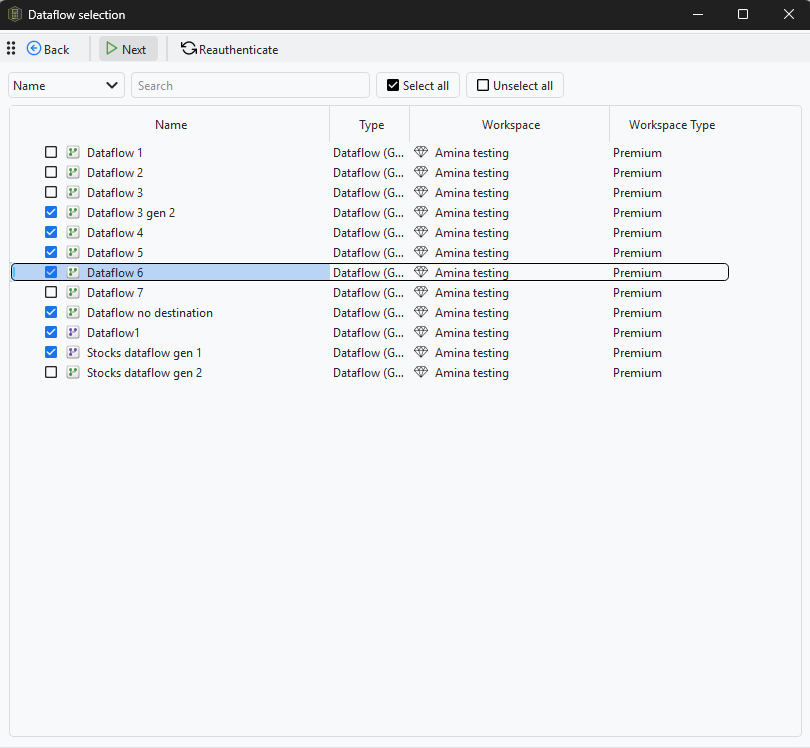
The Dataflow selection window lists every dataflow in those workspaces, with its type and workspace. Tick one or more and click Next:
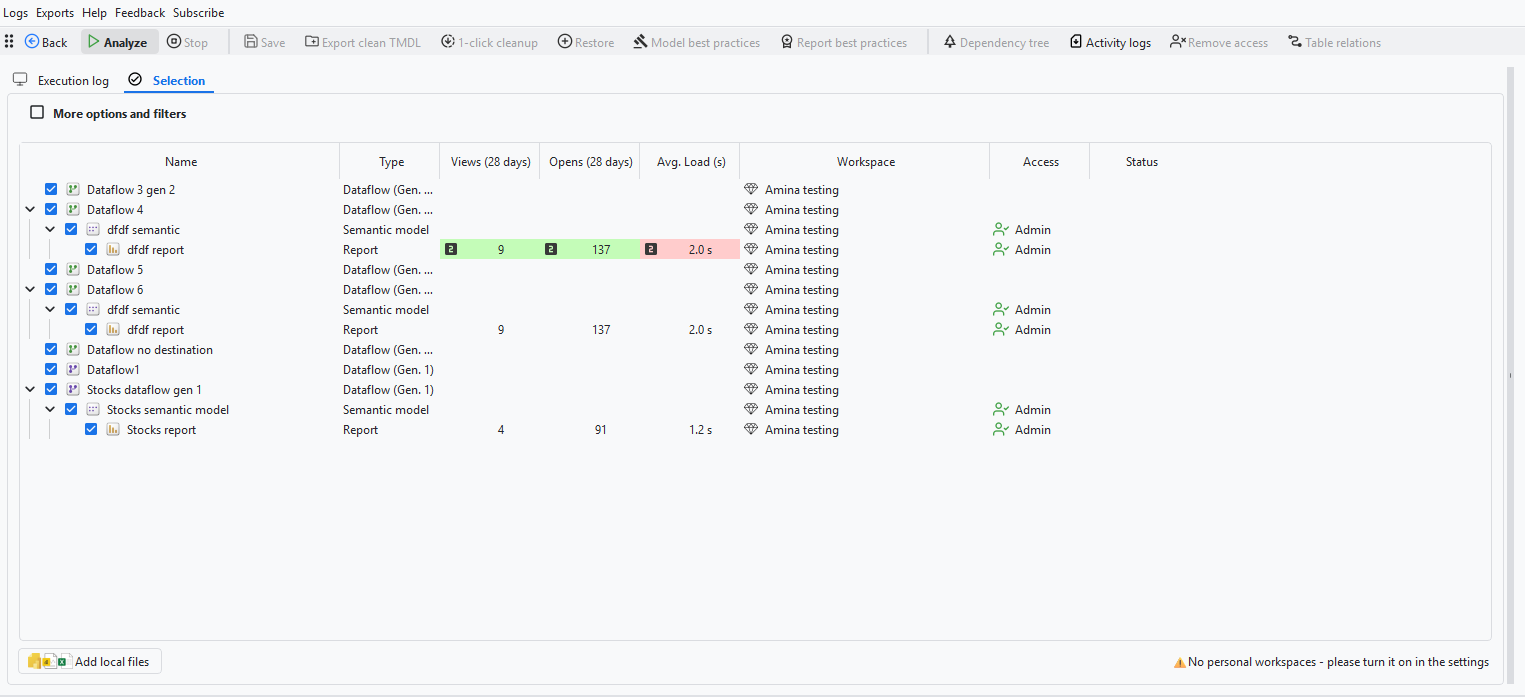
The Selection tab then shows each dataflow with the semantic models and reports that read from it, along with report views, opens and load times for the last 28 days. Untick anything you want to leave out and click Analyze:
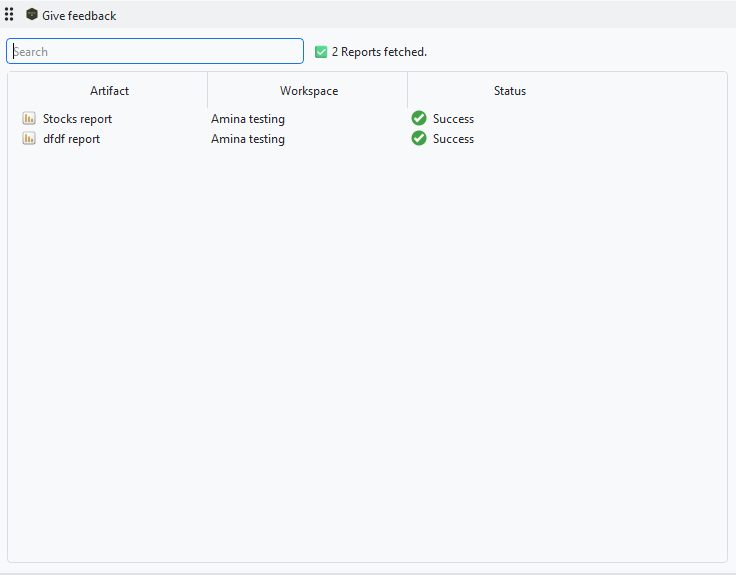
Measure Killer fetches the layout of every downstream report, so it can see which columns end up in visuals and filters:
Read the result
When the progress bar reaches 100%, use the dropdown above the execution log to switch between the dataflows you analyzed. The downstream semantic models are in the same list:
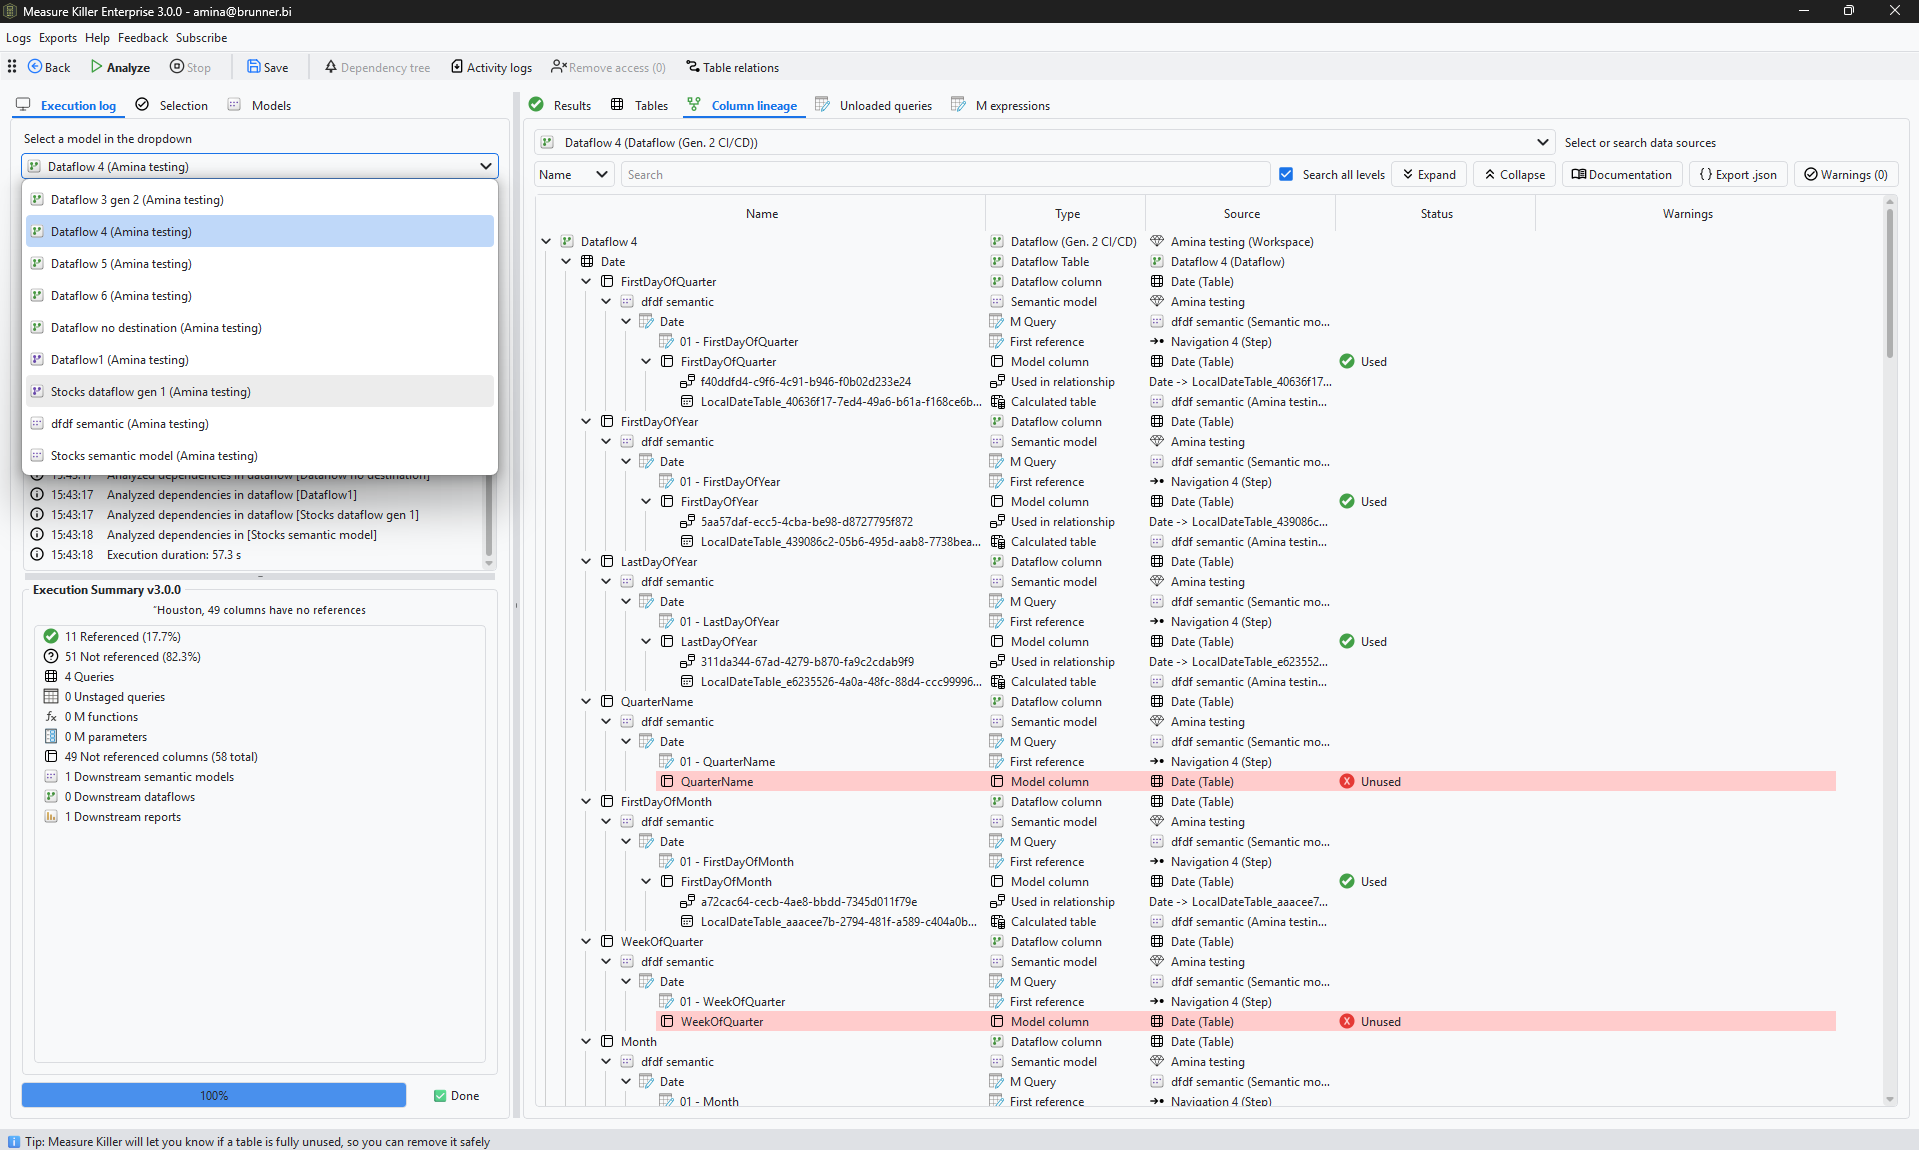
The Execution Summary sums up the selected dataflow, and the Column lineage tab lists its tables. Here is a Gen1 dataflow that feeds one semantic model and one report. 56 of its 72 columns are not used by anything:
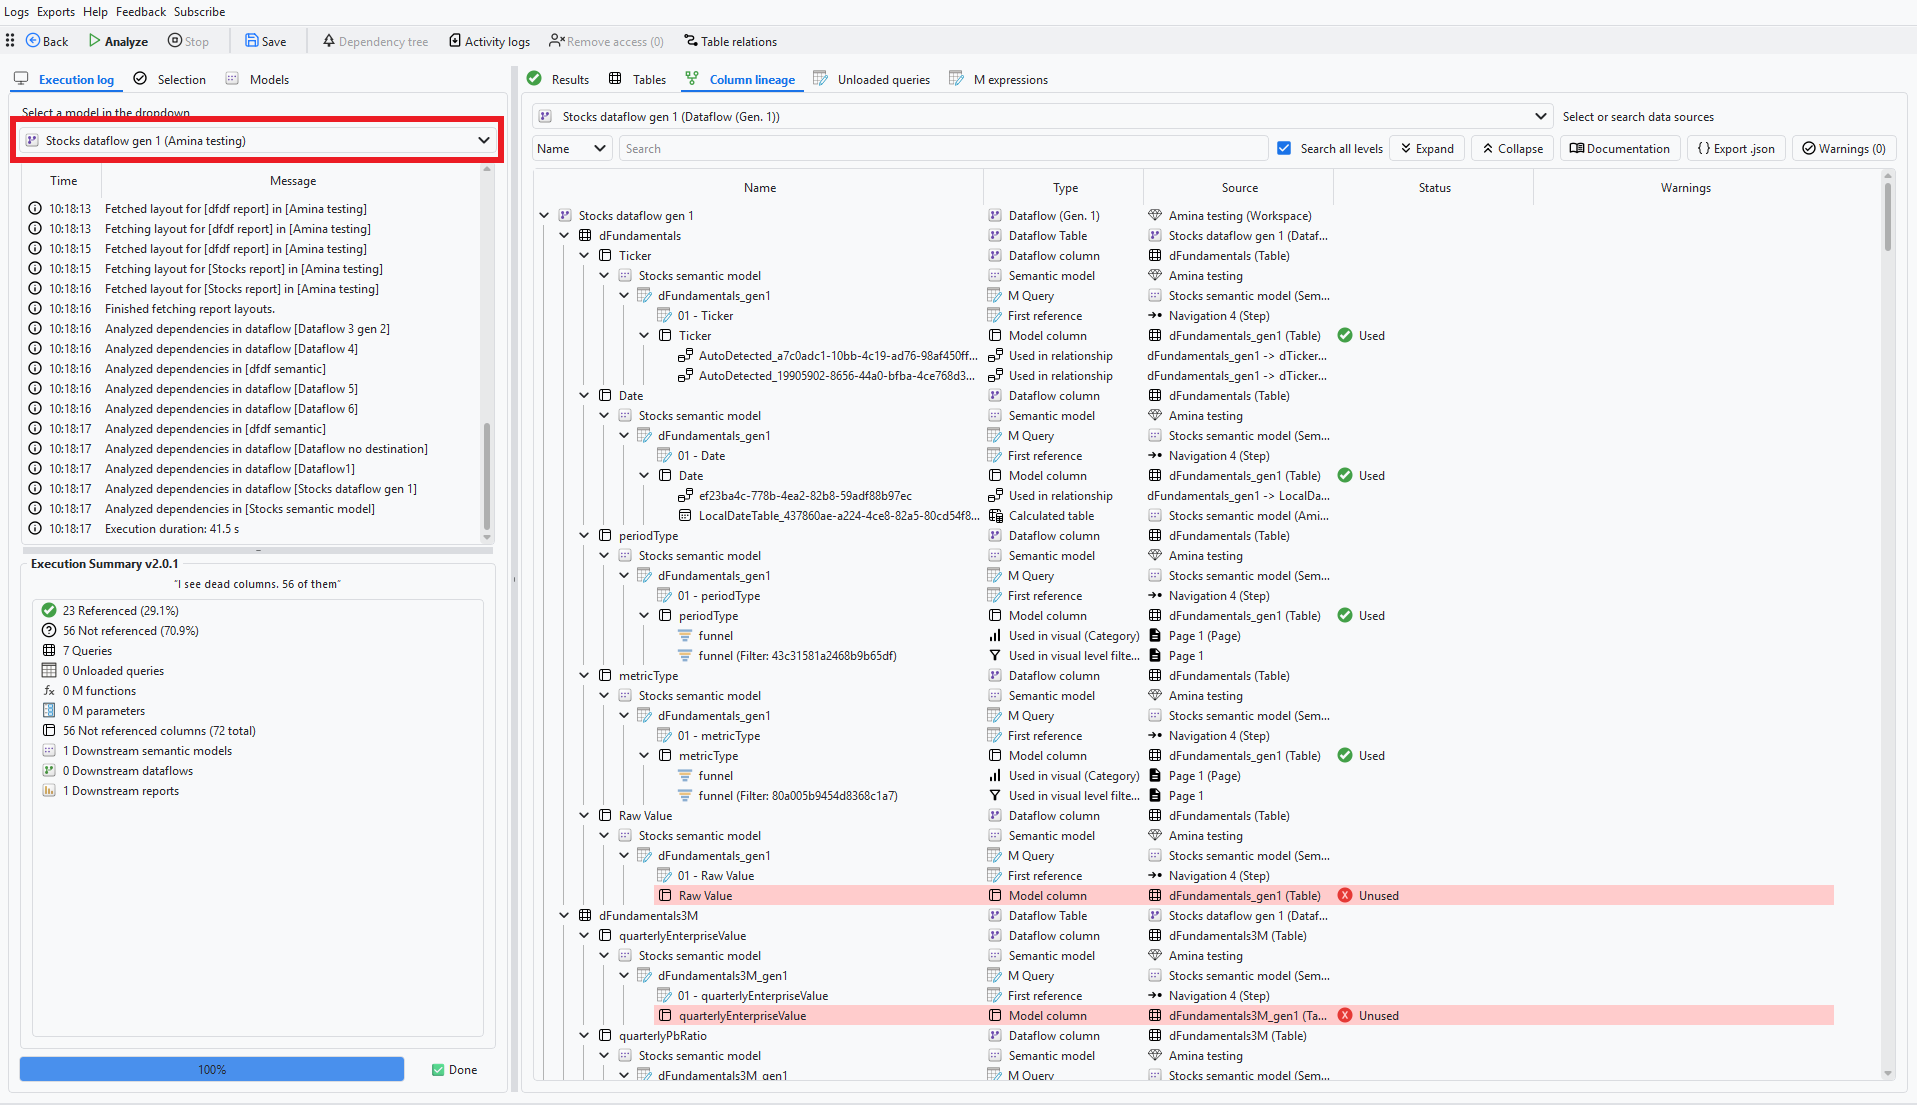
- Referenced and Not referenced: queries and columns that downstream artifacts use, and those they do not.
- Queries and Unloaded queries: how many queries the dataflow has, and how many of them are not loaded.
- M functions and M parameters defined in the dataflow.
- Not referenced columns: your cleanup candidates, with the total next to it.
- Downstream semantic models, dataflows and reports that read from the dataflow.
Follow a column downstream
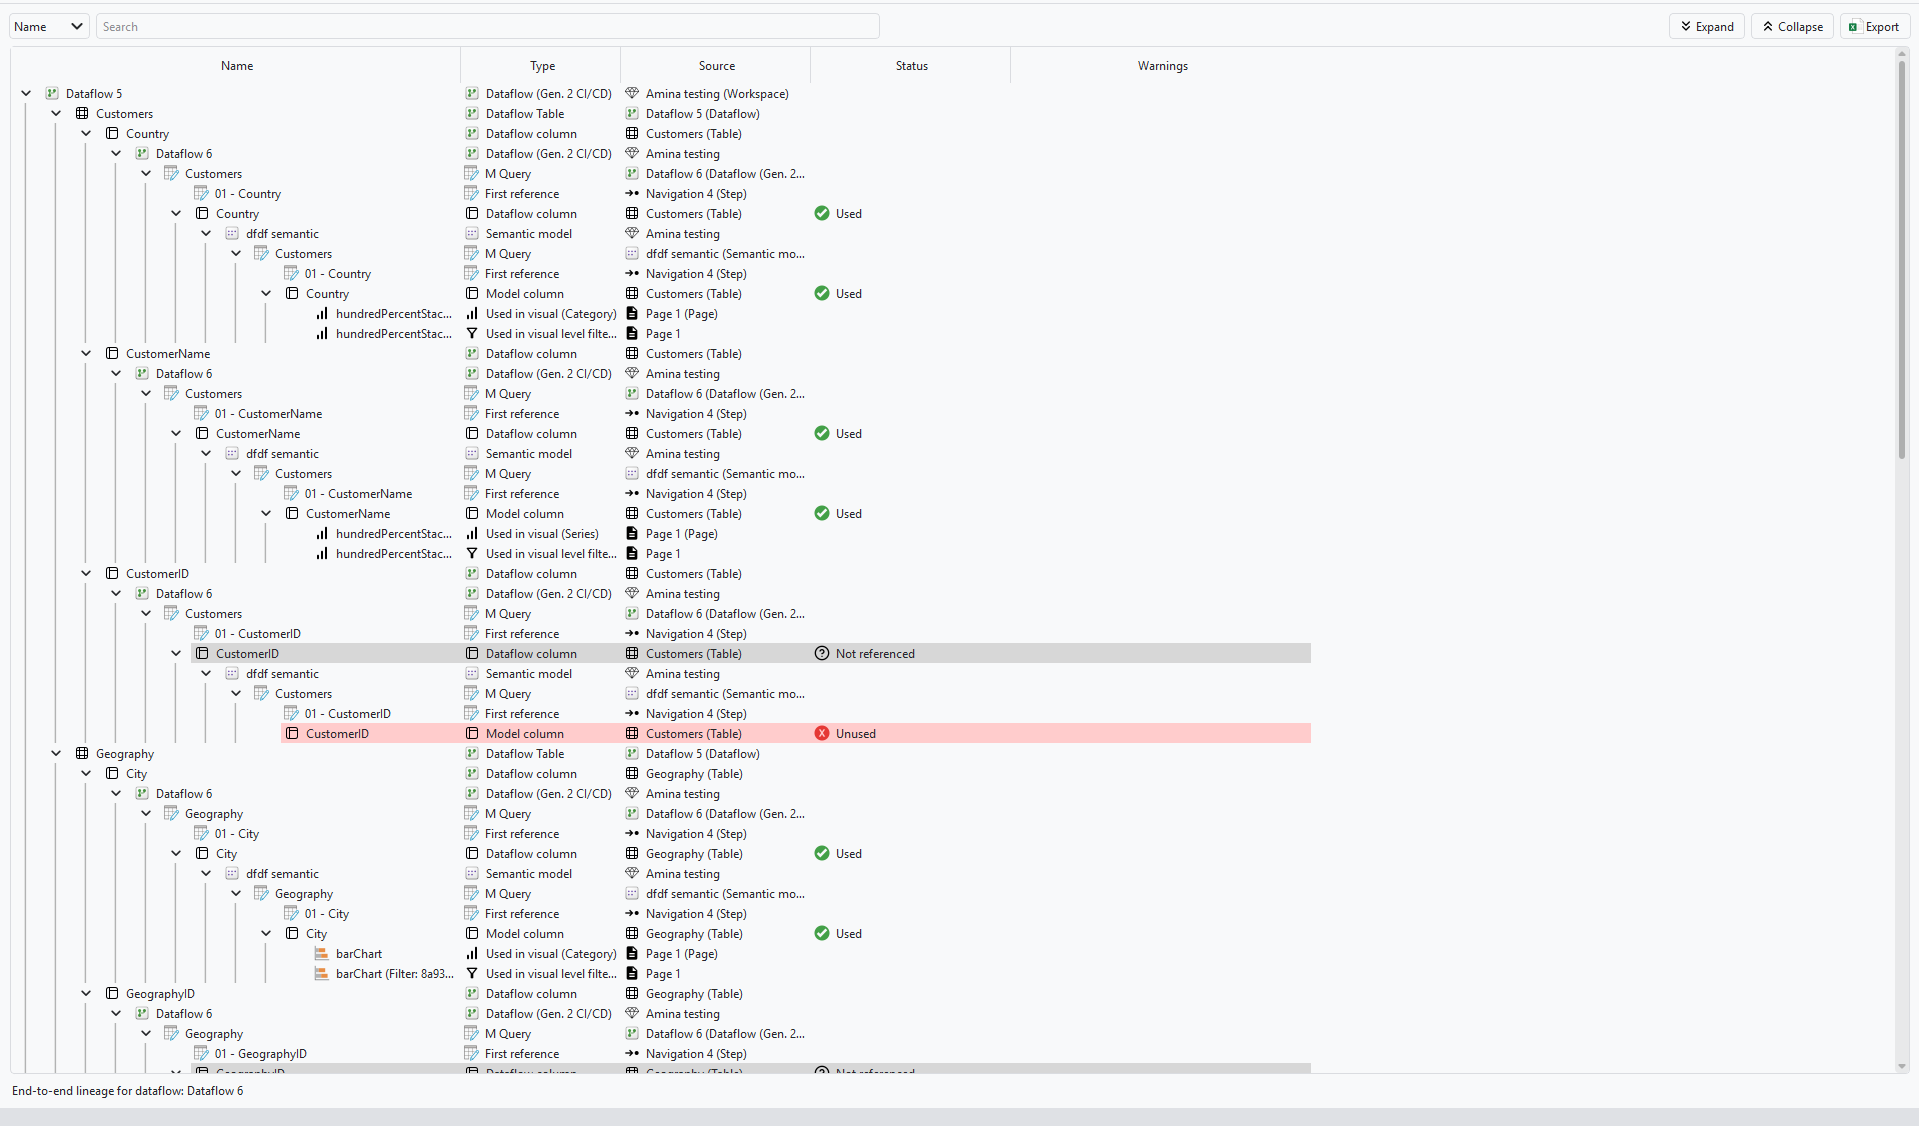
In the Column lineage tab, expand a table and a column to see which downstream dataflows and semantic models read it, the Power Query steps in between, and the visuals and filters that use it in the end. A model column that nothing uses is marked Unused in red.
You can also right-click the dataflow, one of its tables or a column and pick View column lineage to open the full chain in a window of its own, or View column lineage graph to see it as a graph (more on both):
Right-click the dataflow and pick View M Expressions to read its Power Query code.
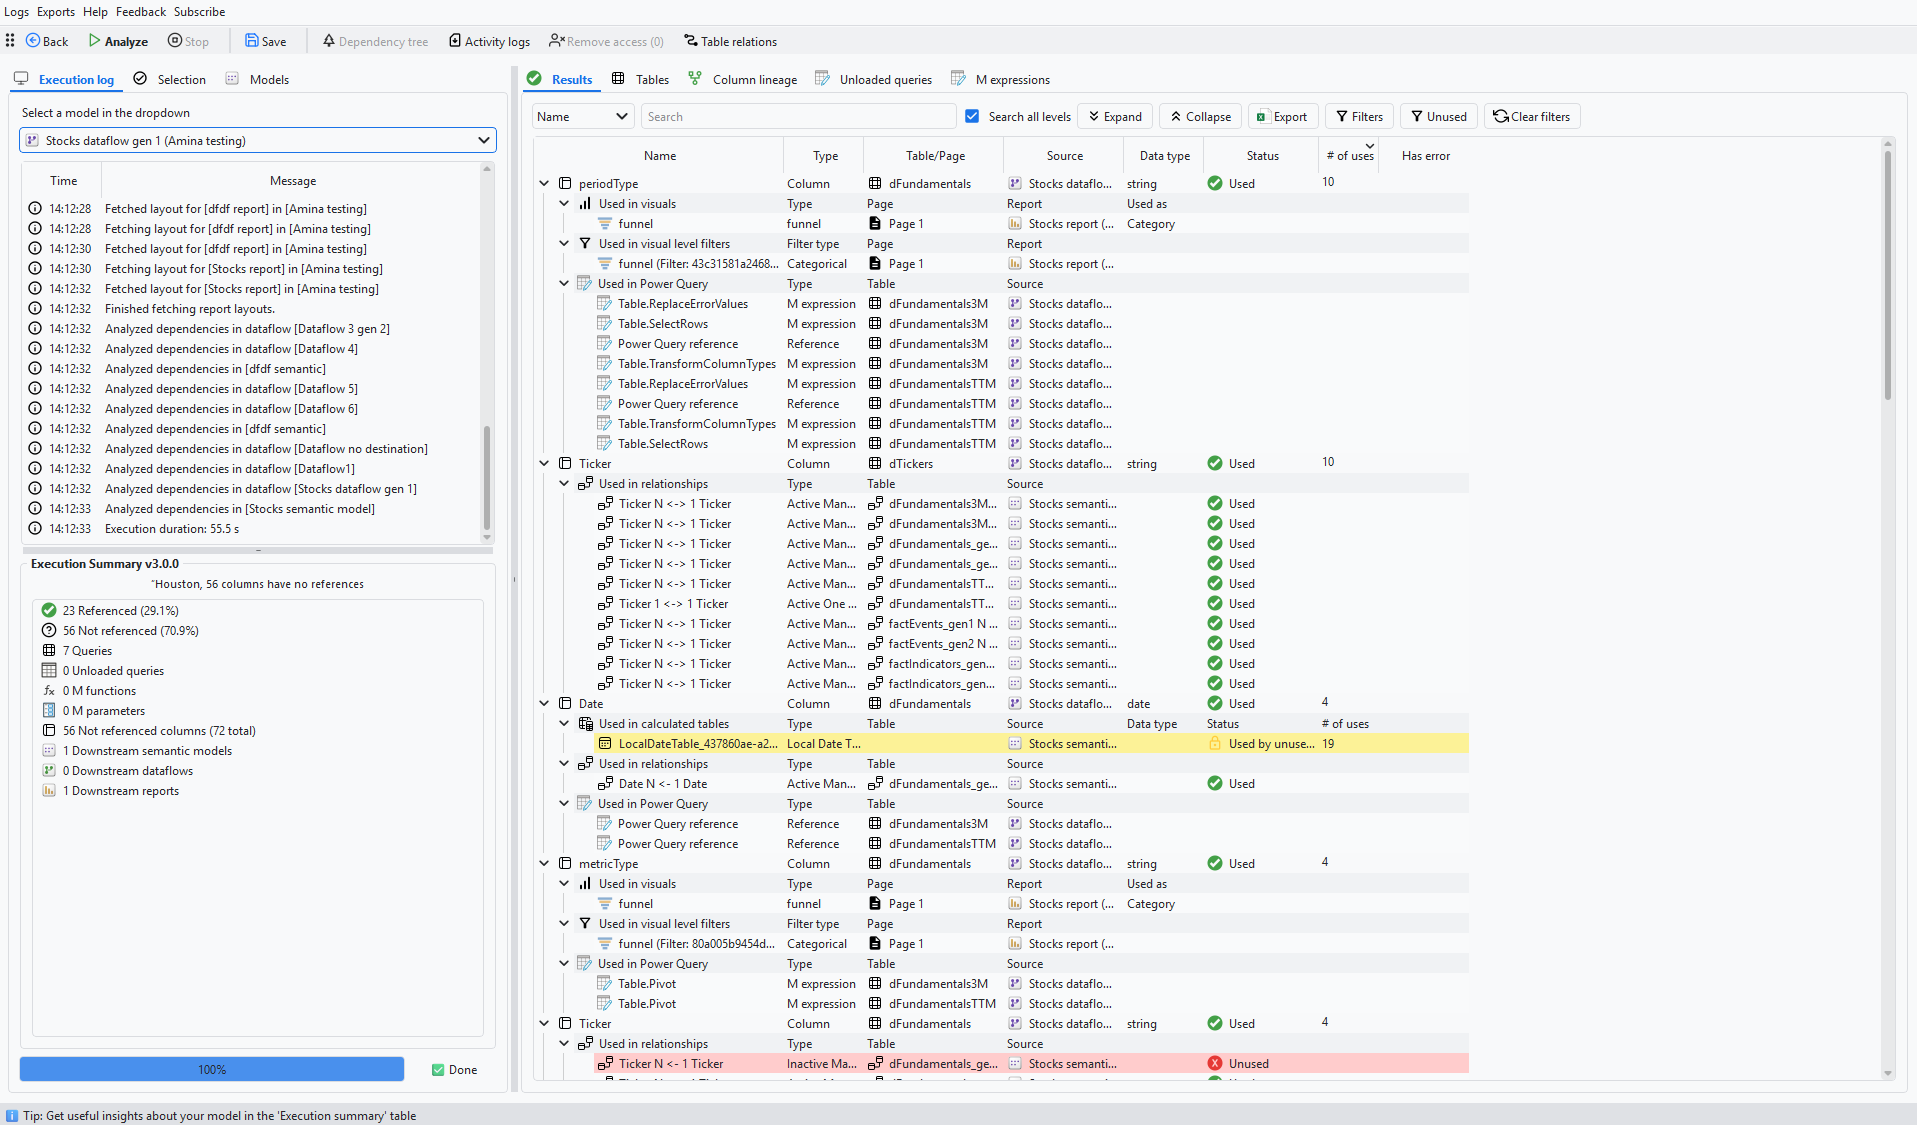
The Results tab turns it around and lists every dataflow column with how often it is used and where: in visuals, visual level filters, relationships, calculated tables and Power Query steps of the downstream artifacts. Click Unused to filter the list down to the columns nothing uses, and Export to take it to Excel:
Clean it up
There is no automatic cleanup for dataflows yet. Measure Killer tells you what is safe to remove, and you remove it yourself in the Power Query editor of the dataflow. The Unused filter in the Results tab gives you the list to work through.
Editions and permissions
Dataflow Analysis is part of Measure Killer Enterprise and MK Automation. It needs a Fabric Administrator (or Power Platform Administrator) account for now, because it sits in the Admin modes section of the app.
You can request a free trial of Measure Killer here.
Something wrong or out of date on this page?