 Measure Killer
Analyze a Lakehouse, Warehouse or Fabric SQL Database
Start from one or more Fabric Lakehouses, Warehouses or SQL Databases and see which of their tables, views and columns are used by semantic models, dataflows, reports and visuals, and which are not used anywhere.
Last updated · November 4, 2026
A Lakehouse or a Warehouse usually starts small and clean. A year later it has staging tables nobody remembers, views that were built for one report, and columns that were loaded “just in case”. Before you drop any of them, you want to know whether a semantic model, a report or a single visual still depends on them.
This mode answers exactly that. You pick one or more Lakehouses, Warehouses or Fabric SQL Databases, and Measure Killer shows every schema, table, view and column inside them, which of them are referenced downstream, and the full chain from each column to the visuals that show it.
How it works
Measure Killer connects to the item’s SQL analytics endpoint to read the list of schemas, tables, views and columns. It reads metadata only, never your rows. Everything downstream of the item, semantic models (Import, DirectQuery, Direct Lake on OneLake and Direct Lake on SQL), dataflows, reports, paginated reports and their visuals, comes from the metadata in your Power BI and Fabric tenant.
These chains are covered:
- Direct Lake on OneLake: Lakehouse or Warehouse → Direct Lake semantic model → reports and visuals.
- Direct Lake on SQL: Lakehouse or Warehouse → SQL analytics endpoint → Direct Lake semantic model → reports and visuals. The lineage shows it the same way: first the SQL analytics endpoint, then the models that use Direct Lake on SQL below it.
- Import or DirectQuery through the SQL analytics endpoint: Lakehouse → SQL analytics endpoint → Import or DirectQuery semantic model → reports and visuals.
- Through a dataflow: Lakehouse → dataflow → semantic model → reports and visuals.
Dependencies between lakehouses, warehouses and notebooks are shown at the item level only, not at the column level. See Item lineage for those, and Lineage coverage and limitations for everything else the lineage does not trace.
Developer or Admin
The tile exists twice on the welcome screen, under Developer modes and under Admin modes. The analysis is the same. The difference is how much of your tenant Measure Killer can see when it looks for models and reports that read from the item:
- Developer modes: only what your own workspace roles allow. You need Contributor or higher where the item and the semantic models live, and Viewer where only reports live.
- Admin modes: every workspace in the tenant, using the admin APIs. Use this if you need to be sure that nothing outside your own workspaces depends on a column before you drop it.
We start with the Developer tile. The Admin tile differs in the first few steps only, see Run it as an admin below.
Pick the items
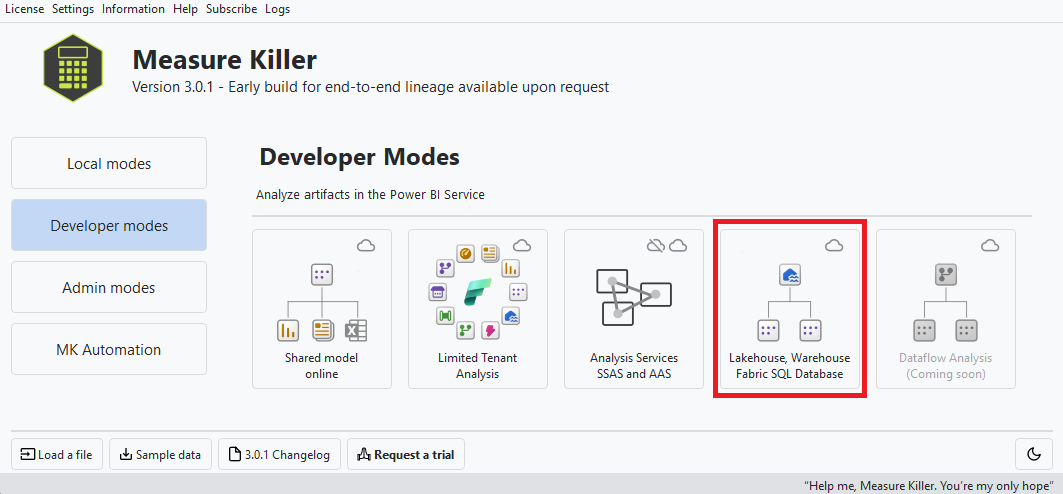
On the welcome screen, open Developer modes and click Lakehouse, Warehouse, Fabric SQL Database:
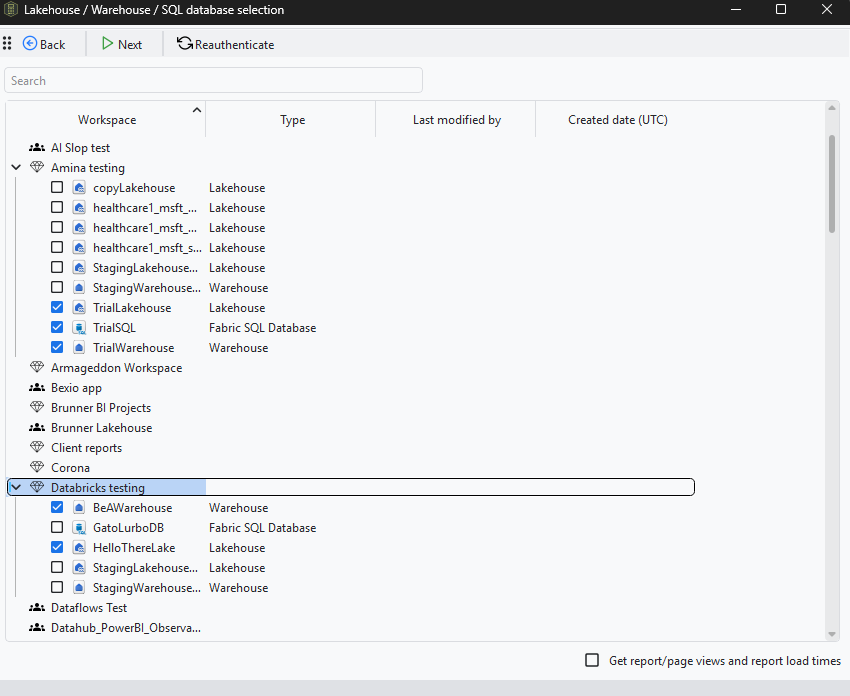
After you sign in, Measure Killer lists the workspaces you have access to. Expand a workspace and tick the Lakehouses, Warehouses and SQL Databases you want to analyze. You can pick several, across workspaces. Tick Get report/page views and report load times at the bottom if you want usage numbers next to the reports, then click Next:
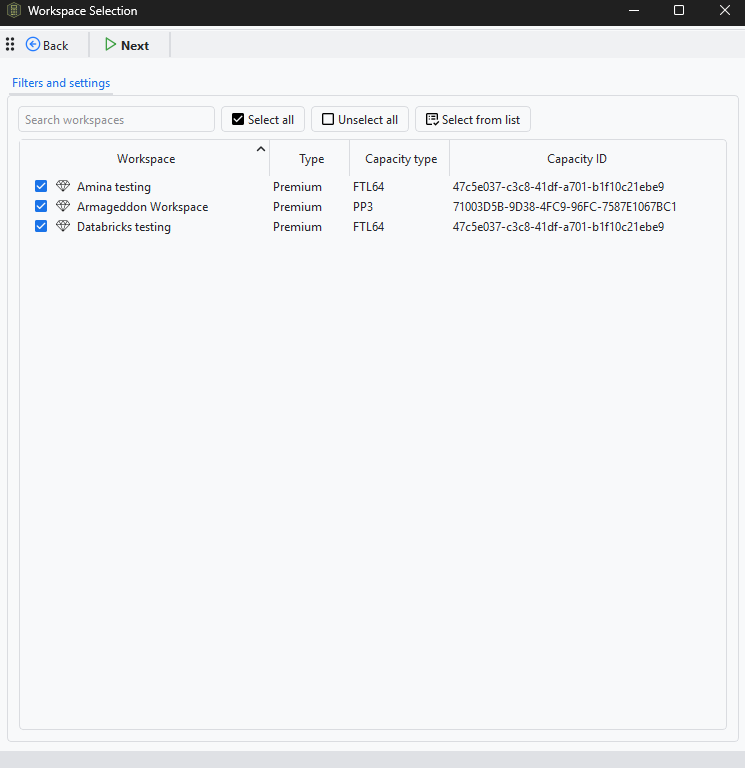
Next, Measure Killer lists the workspaces it will search for semantic models, dataflows and reports that read from your selection. This can include workspaces that only hold reports, where a Viewer role is enough. Keep them all ticked, or untick the ones you want to skip, and click Next:
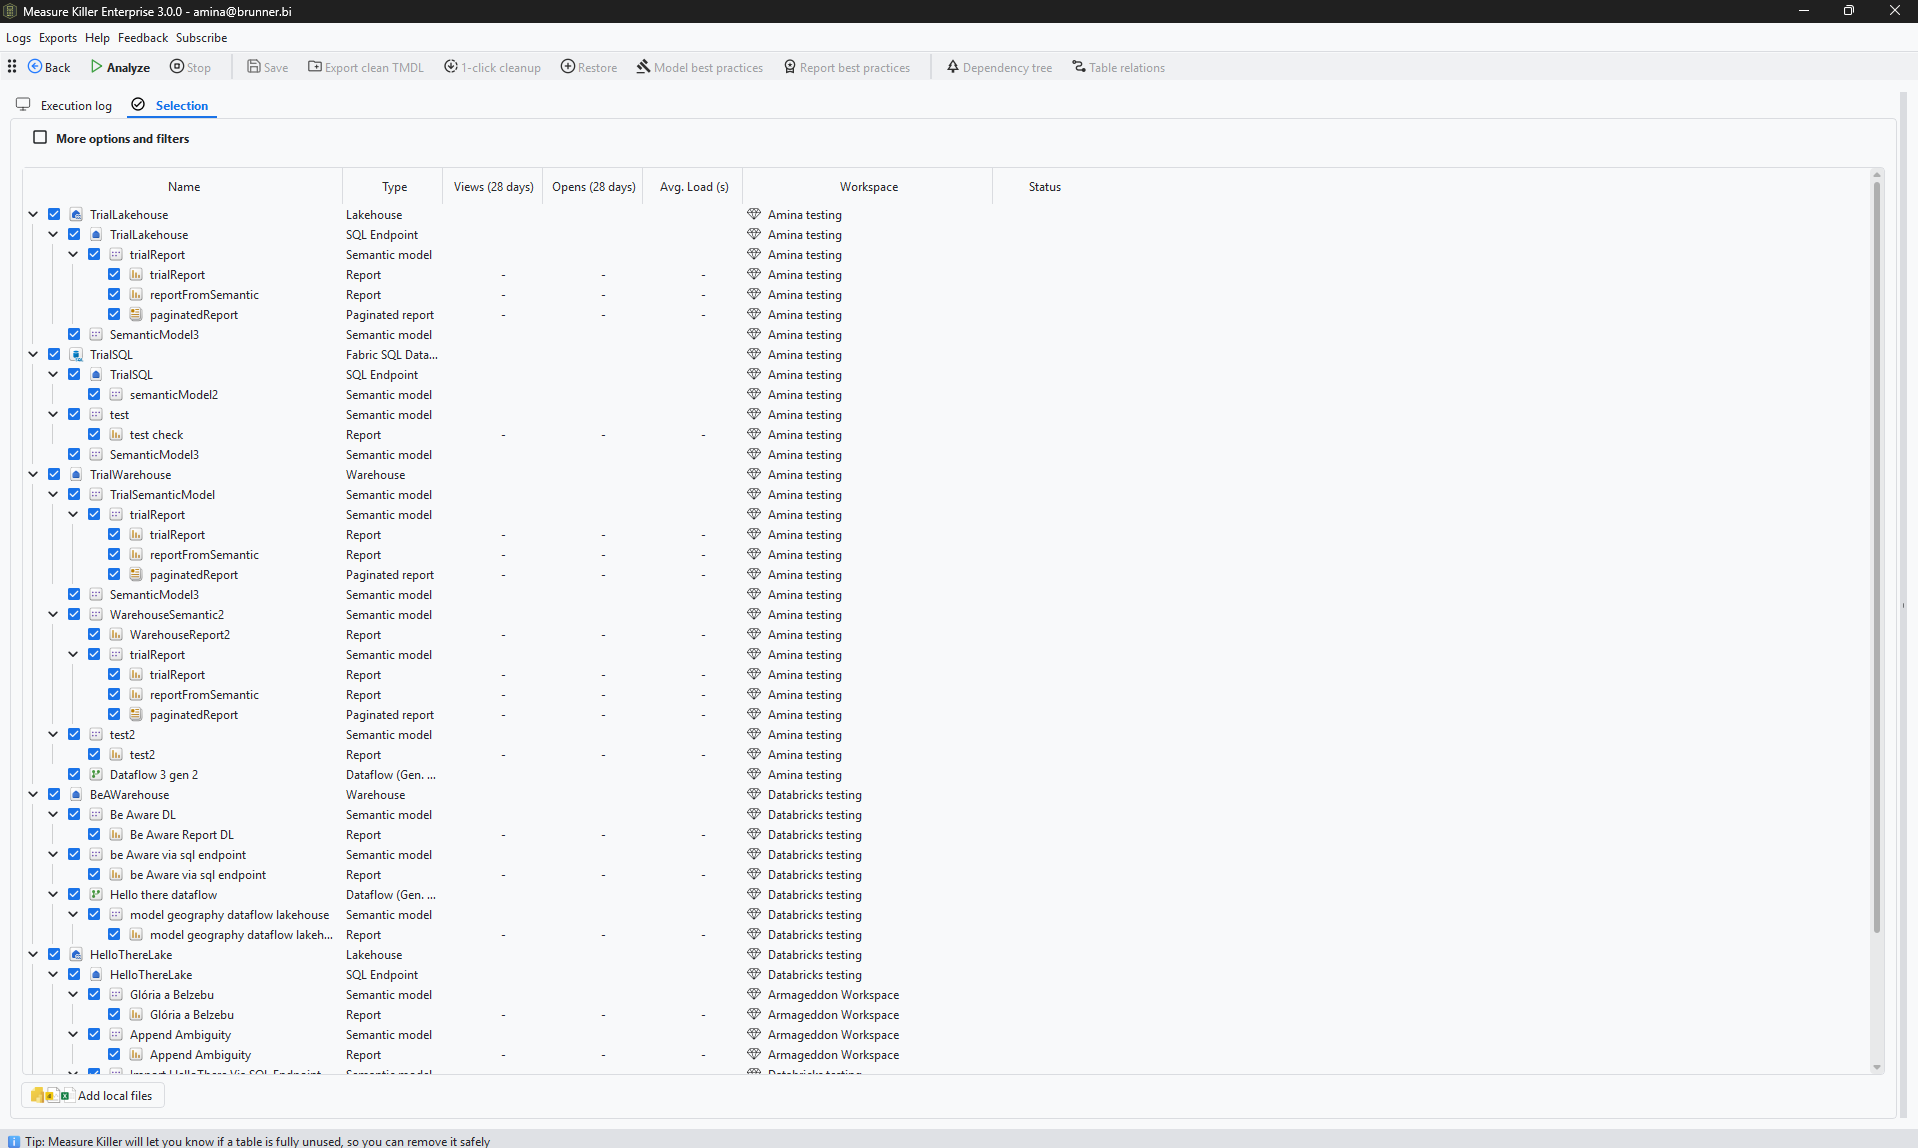
The Selection tab shows each item with everything that reads from it: its SQL analytics endpoint, the semantic models on top, their reports and paginated reports, and dataflows. Untick anything you want to leave out and click Analyze:
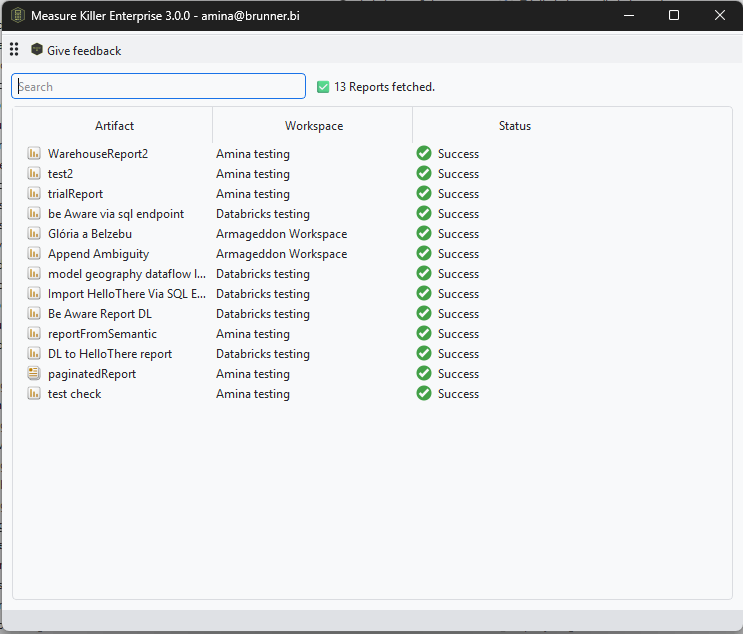
Measure Killer fetches the layout of every report it found, so it can see which columns end up in visuals and filters:
Read the result
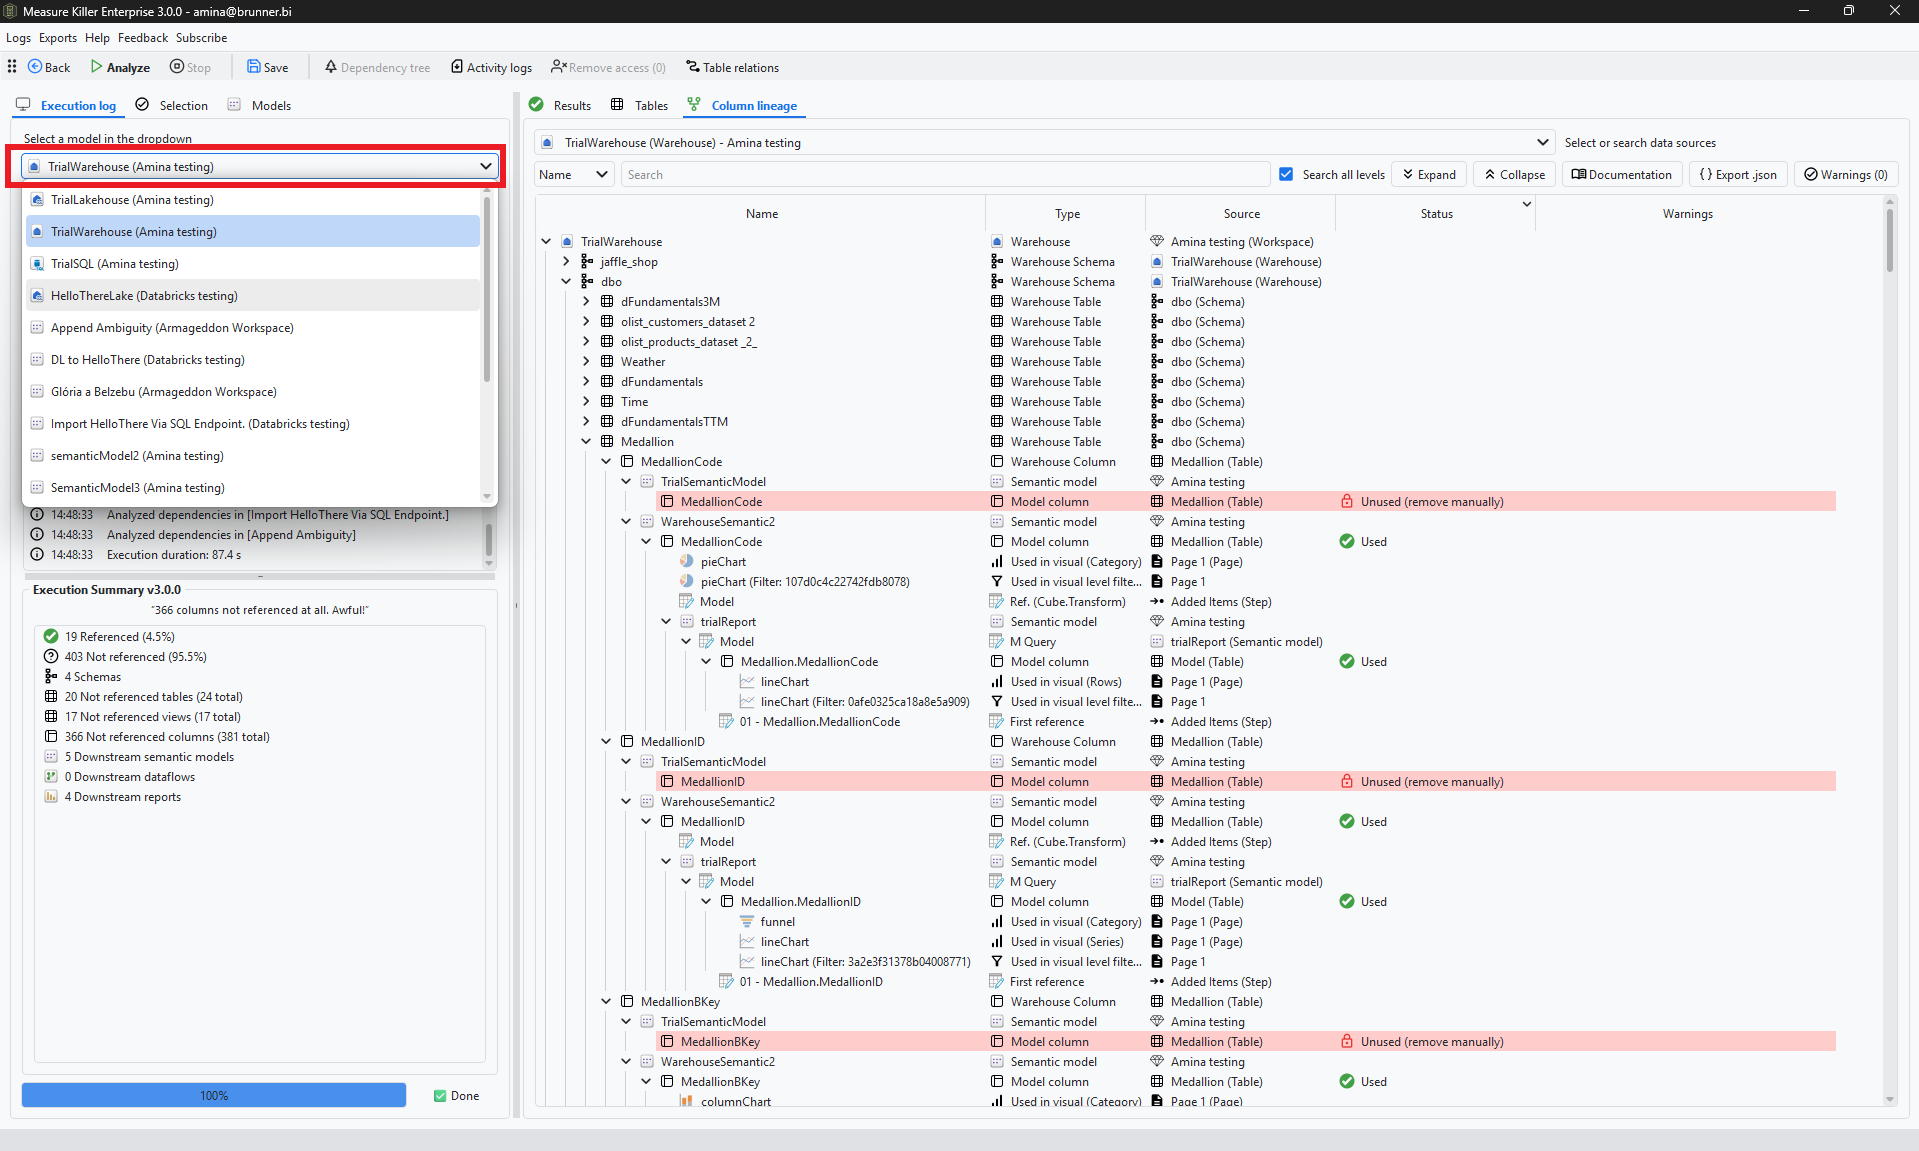
When the progress bar reaches 100%, use the dropdown above the execution log to switch between the items you analyzed. The downstream semantic models and dataflows are in the same list. The Execution Summary below it tells you how much of the selected item is actually used:
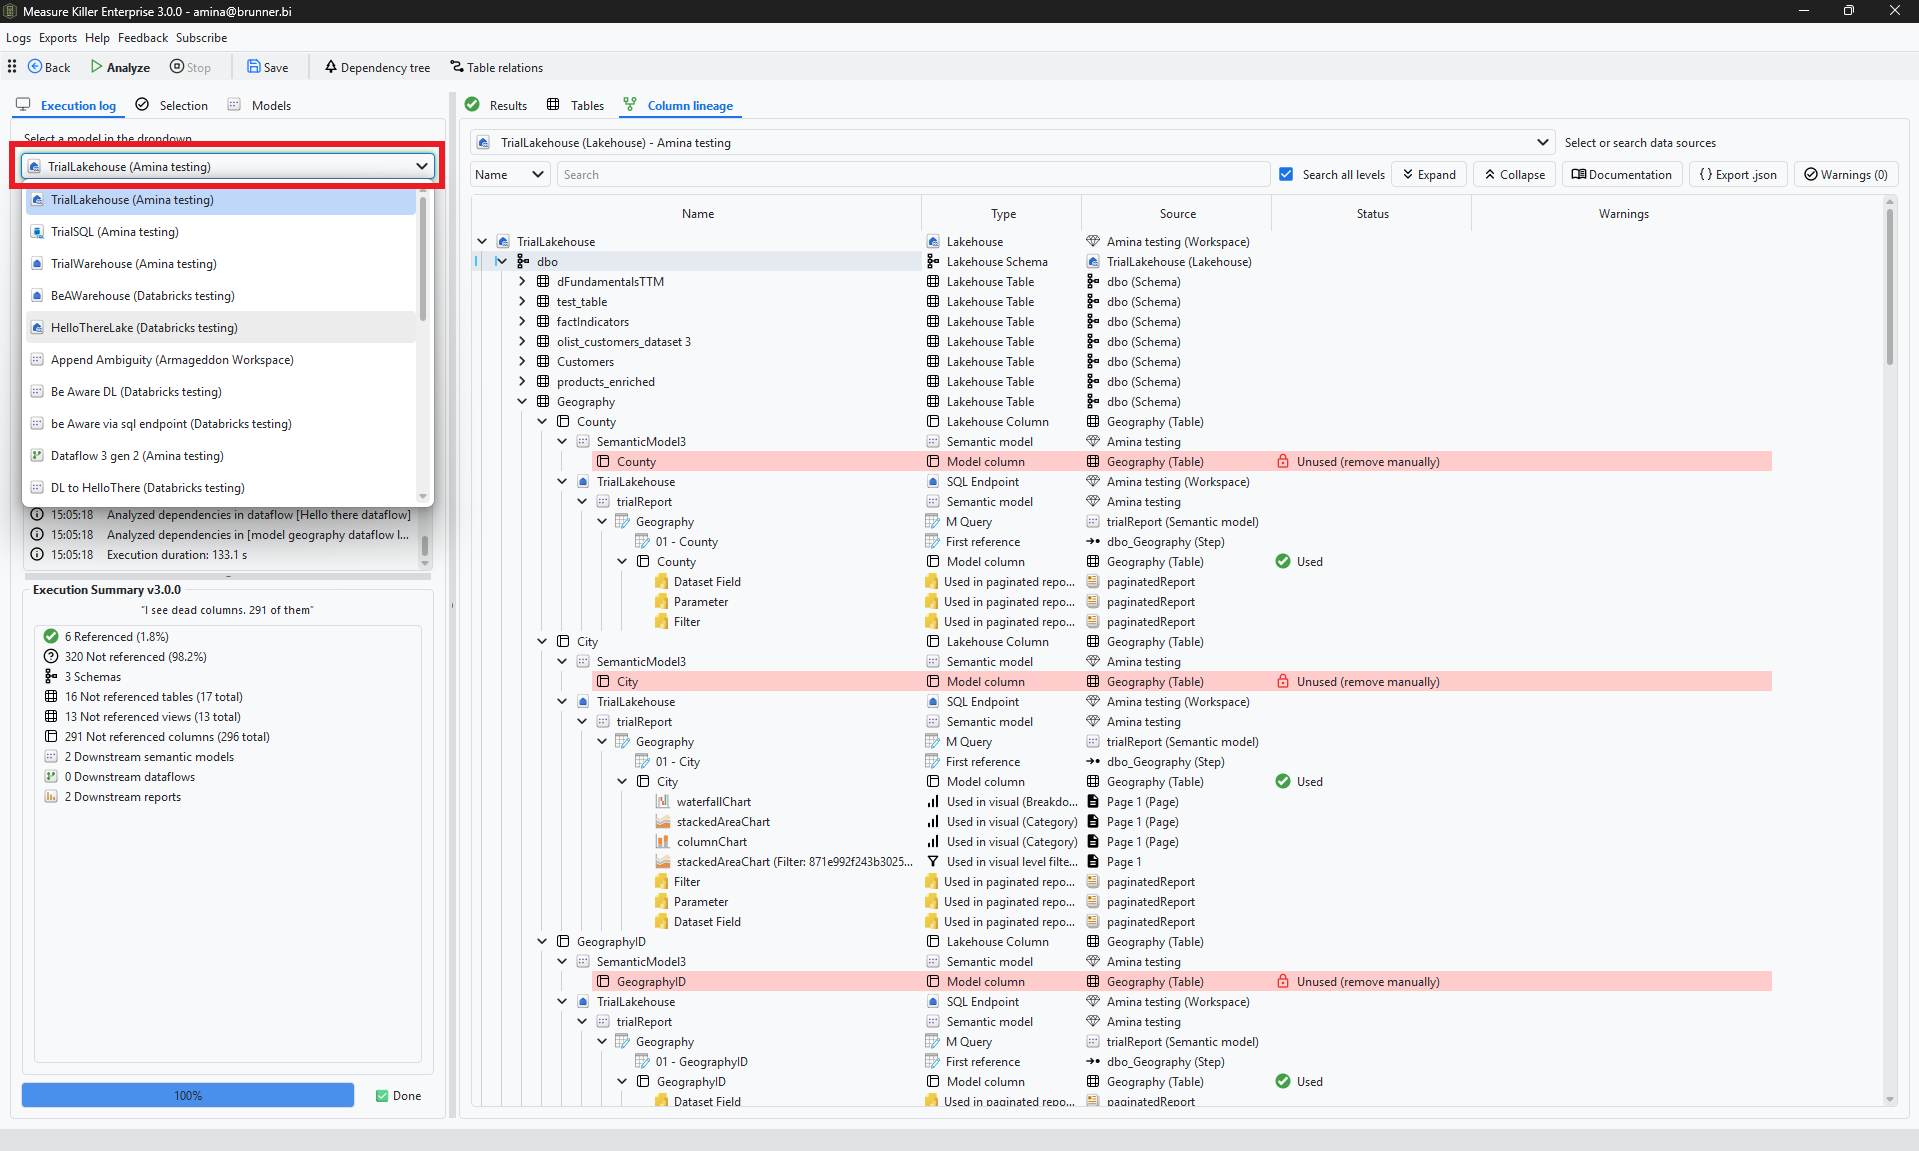
The summary counts tables, views and columns together:
- Referenced: objects that at least one downstream model, dataflow or report uses.
- Not referenced: objects nothing downstream uses. These are your cleanup candidates.
- Not referenced tables, views and columns: the same split per object type, each with the total next to it.
- Downstream semantic models, dataflows and reports: how many artifacts read from the item.
In the lakehouse above, only 6 of 326 objects are referenced. 291 of its 296 columns are not used by anything.
Follow a column to the visuals
The Column lineage tab lists the item as a tree: schemas, then tables and views, then columns. Expand a column to see every semantic model column that reads it, the Power Query steps in between, and the visuals, filters and paginated report fields that use it. A model column that reads from the item but is not used anywhere is marked Unused (remove manually).
To start from a single object, right-click a schema, table, view or column and pick View column lineage. Measure Killer opens the full chain for that object in a window of its own. View column lineage graph shows the same chain as a graph.
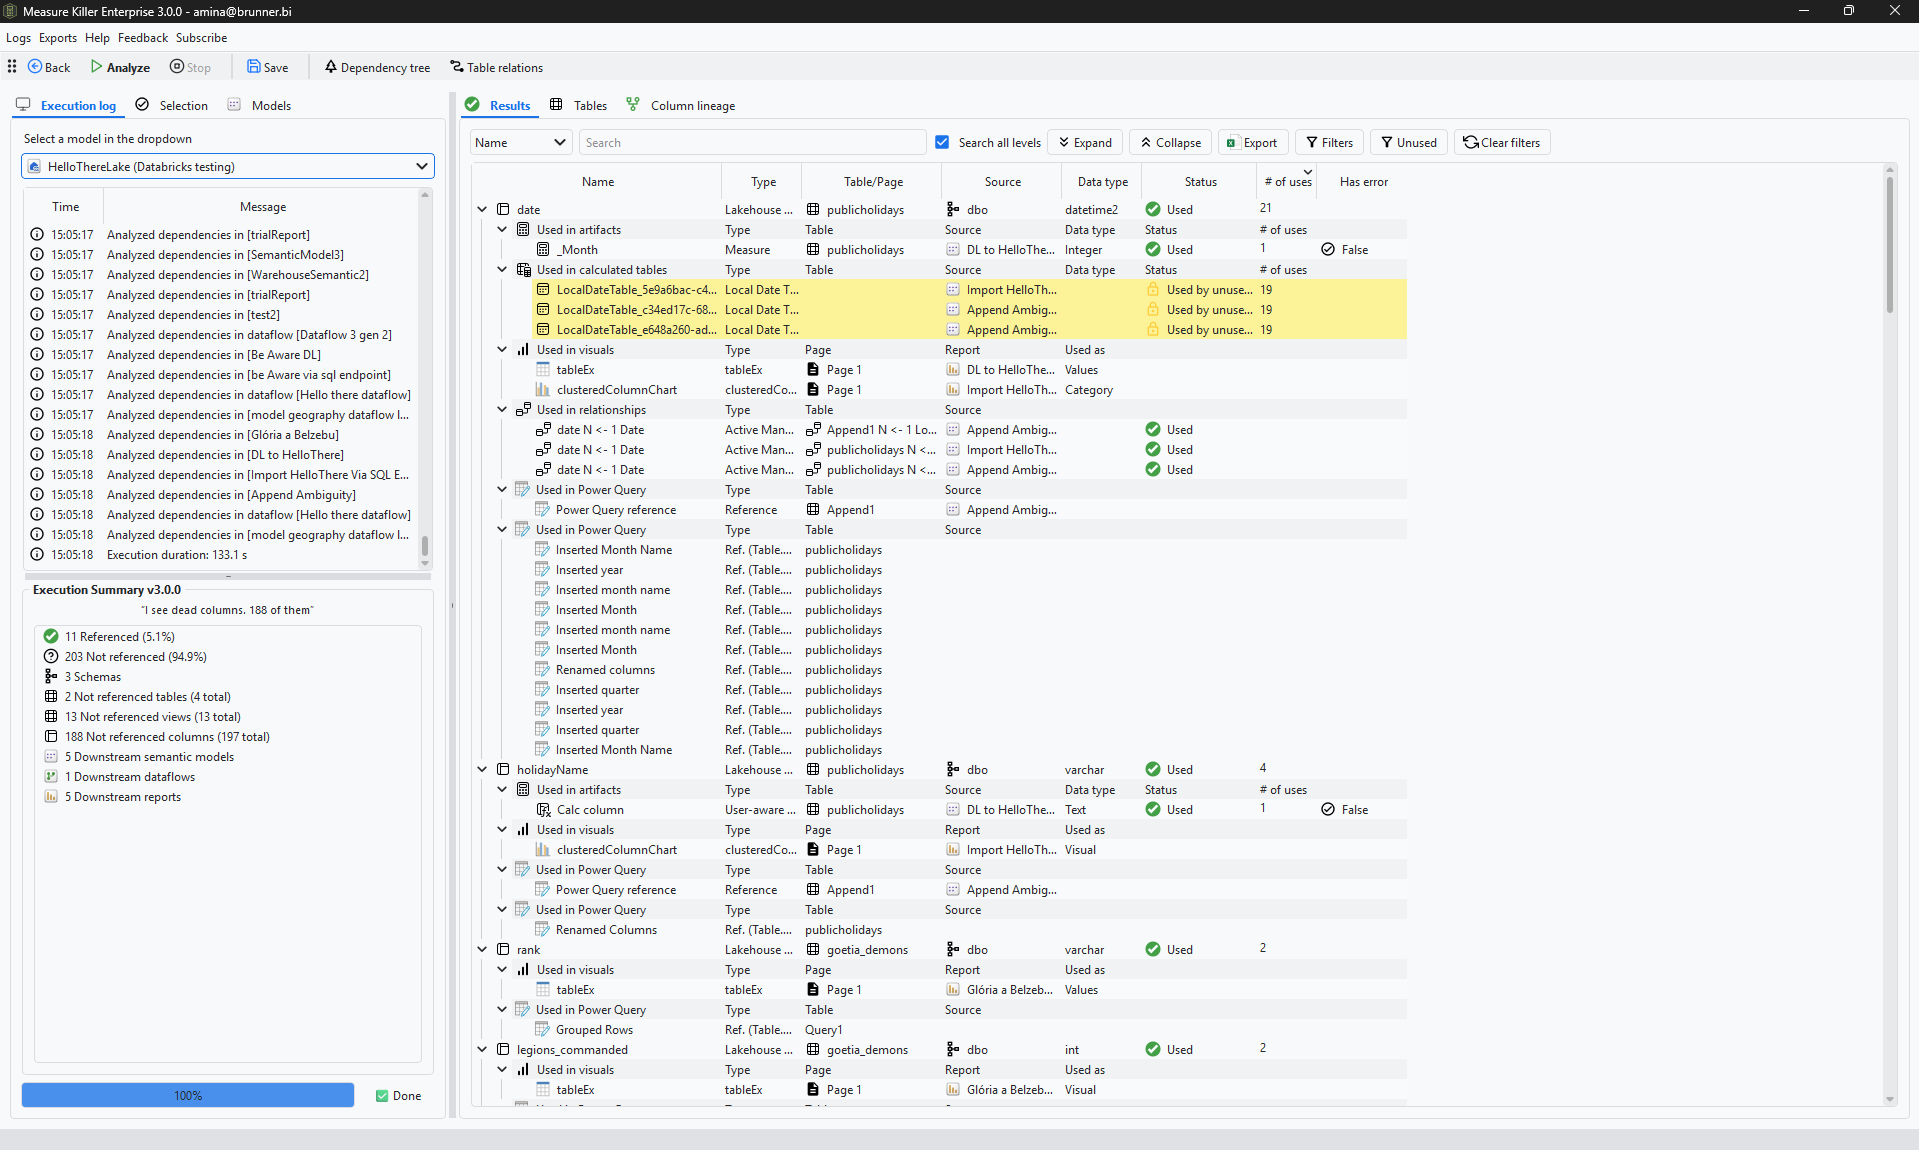
The Results tab lists every column of the item with its data type, how often it is used and where: in measures and calculated columns, calculated tables, relationships, visuals and Power Query steps. Click Unused to see only the columns nothing uses, and Export to take the list to Excel:
Run it as an admin
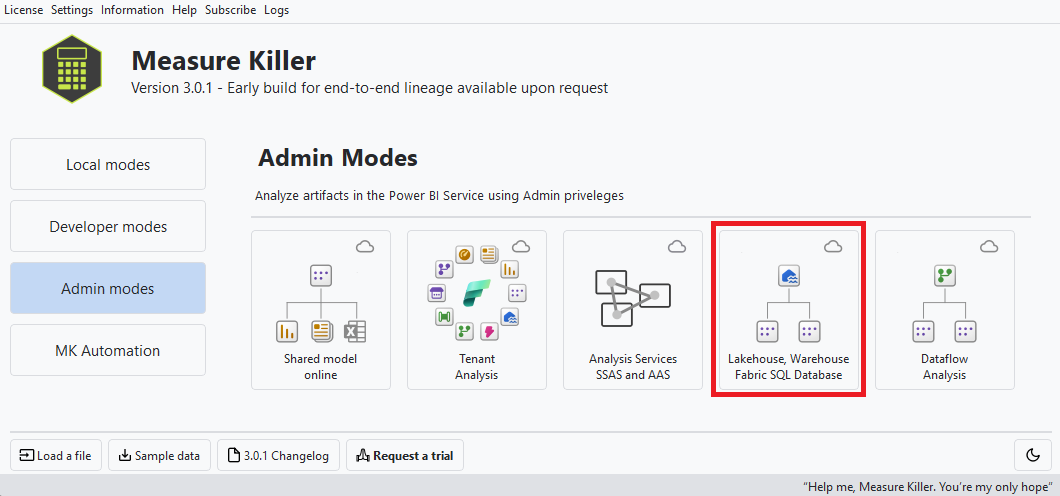
On the welcome screen, open Admin modes and click Lakehouse, Warehouse, Fabric SQL Database:
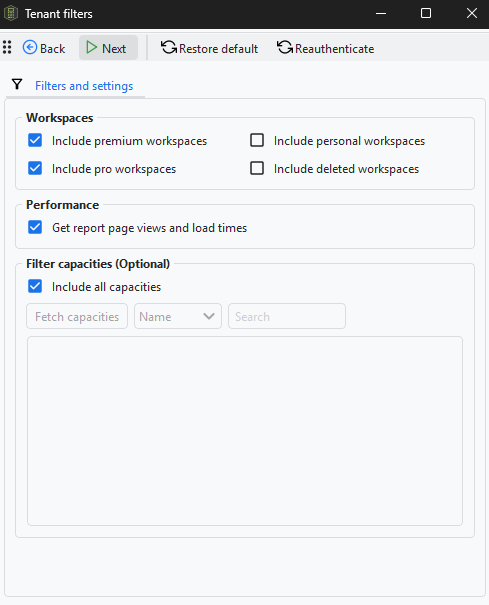
After you sign in with your admin account, the Tenant filters window opens. Choose which workspace types to include, whether to fetch report page views and load times, and optionally limit the search to certain capacities:
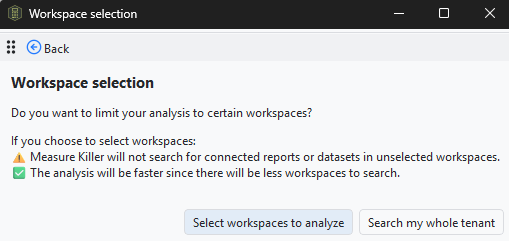
Measure Killer then asks whether to search your whole tenant or only selected workspaces. If you select workspaces, it will not look for connected reports or semantic models in the ones you leave out:
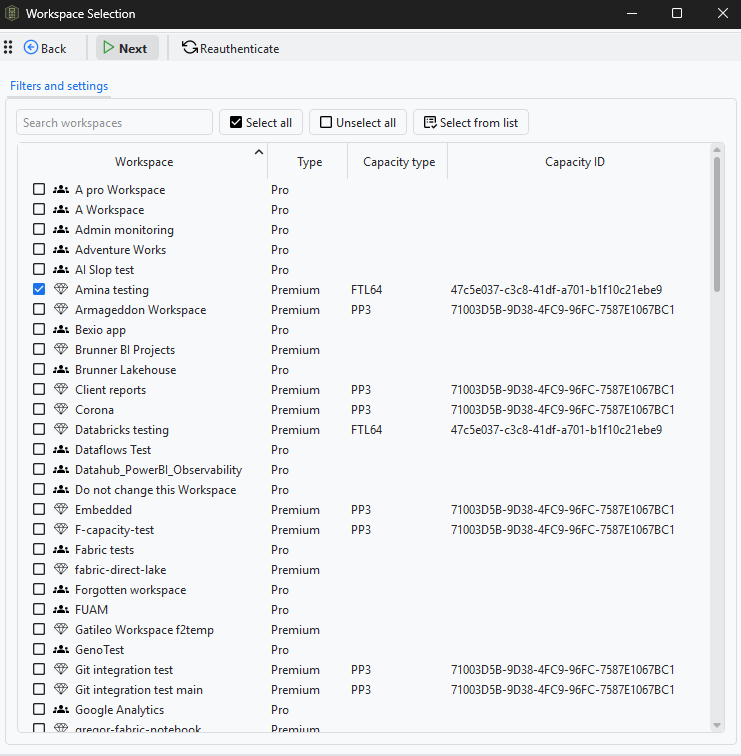
If you chose to select workspaces, tick them in the list and click Next:
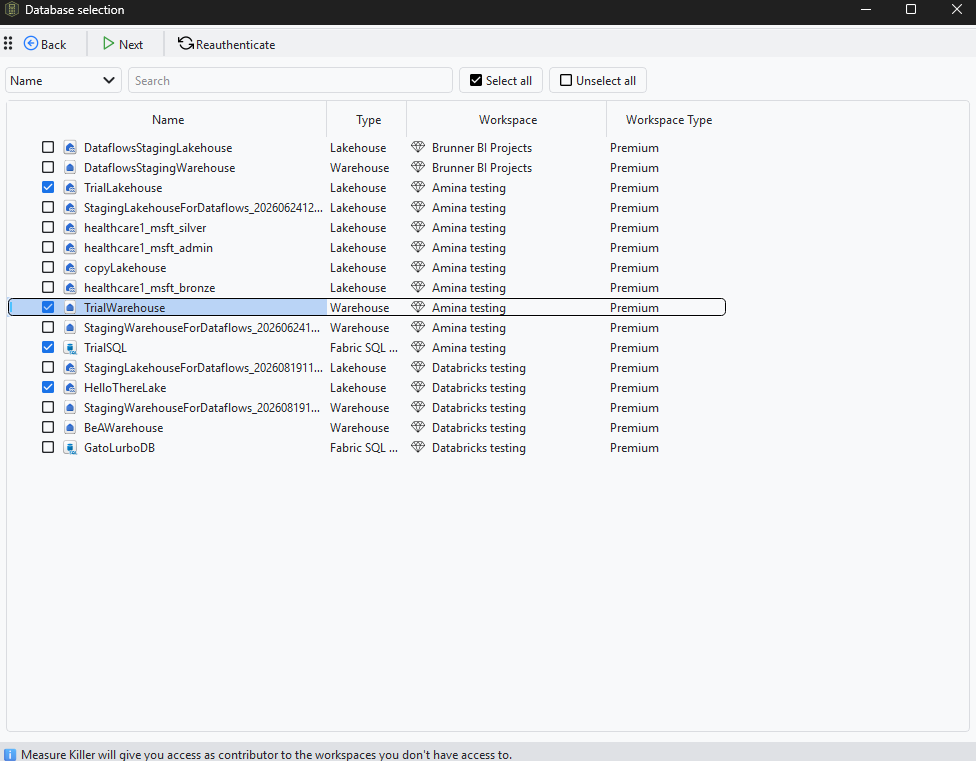
The Database selection window lists every Lakehouse, Warehouse and Fabric SQL Database in those workspaces. Tick the ones you want and click Next. As the note at the bottom says, Measure Killer gives your account Contributor access to workspaces you are not a member of, so it can read the metadata. You can take that access away again with Remove access in the toolbar:
From here it works exactly like the Developer tile: the Selection tab, then Analyze. Here is the result for a warehouse. Measure Killer finds 5 downstream semantic models and 4 reports, and 366 of 381 columns that none of them use:
Editions and permissions
This mode is part of Measure Killer Enterprise and MK Automation. Measure Killer only reads metadata. It does not change anything in your Lakehouse, Warehouse or SQL Database. In Admin modes it may add your account as a Contributor to workspaces you do not have access to, as described above.
You can request a free trial of Measure Killer here.
Something wrong or out of date on this page?