 Measure Killer
How do I trace a database column to every Power BI visual that uses it?
Run Tenant Analysis or Limited Tenant Analysis starting from the data source, then open the Column lineage tab. It follows the column through every dataflow, Power Query step and semantic model down to each visual and filter that uses it.
Last updated · November 9, 2026
Steps
- Open Measure Killer and pick Tenant Analysis or Limited Tenant Analysis on the welcome screen (which one?).
- On the Selection tab, click Datasources and tick the server or database the column lives in. Measure Killer selects everything downstream of it, in every workspace (details).
- Click Analyze.
- Open the Column lineage tab, pick the data source in the dropdown and expand it: database, schema, table, column (details).
- Keep expanding the column. You see every dataflow and semantic model that reads it, the Power Query steps in between, the model column with its used/unused status, and the visuals and filters at the end.
- Prefer a picture? Right-click the table or column and pick View column lineage graph (details).
In Limited Tenant Analysis, the lineage only shows the dependencies of items you selected before you clicked Analyze, and only in workspaces you can access. If a dataflow, model or report you expect is missing, go back to the Selection tab, tick it and analyze again.
What you see
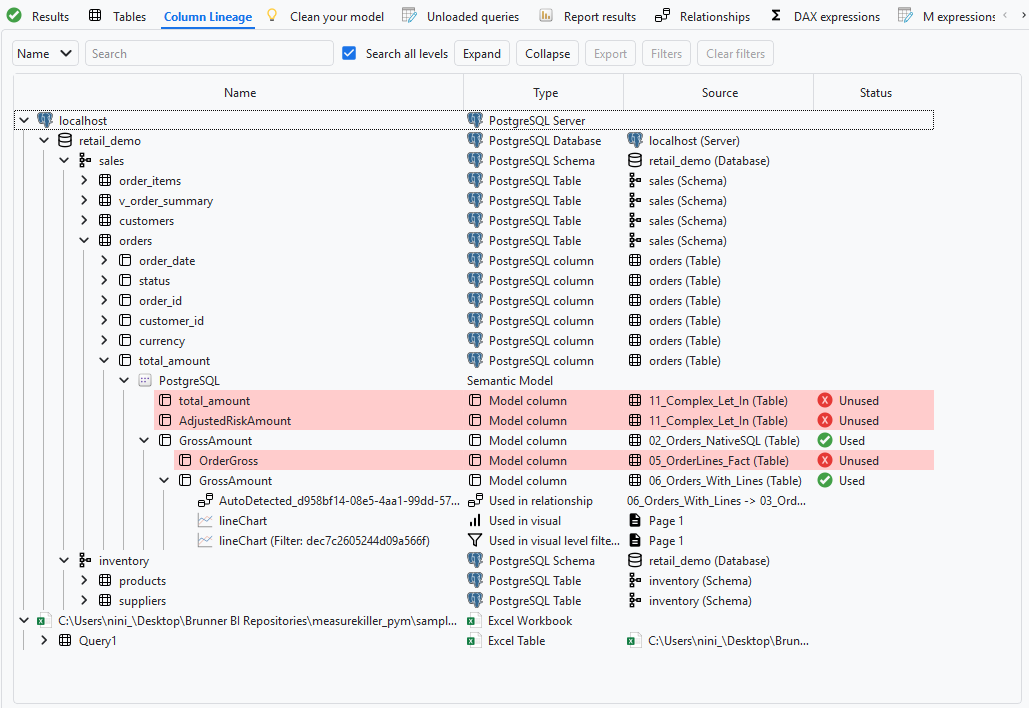
Only have one model open in Power BI Desktop? The free edition traces that model from source to visual, see One model, in the free edition.
Go deeper
- Data lineage in Power BI, from source to visual
- Lineage coverage and limitations: which sources are supported at column level
Something wrong or out of date on this page?