 Measure Killer
How do I see how often Power BI reports and pages are opened, and which ones nobody uses?
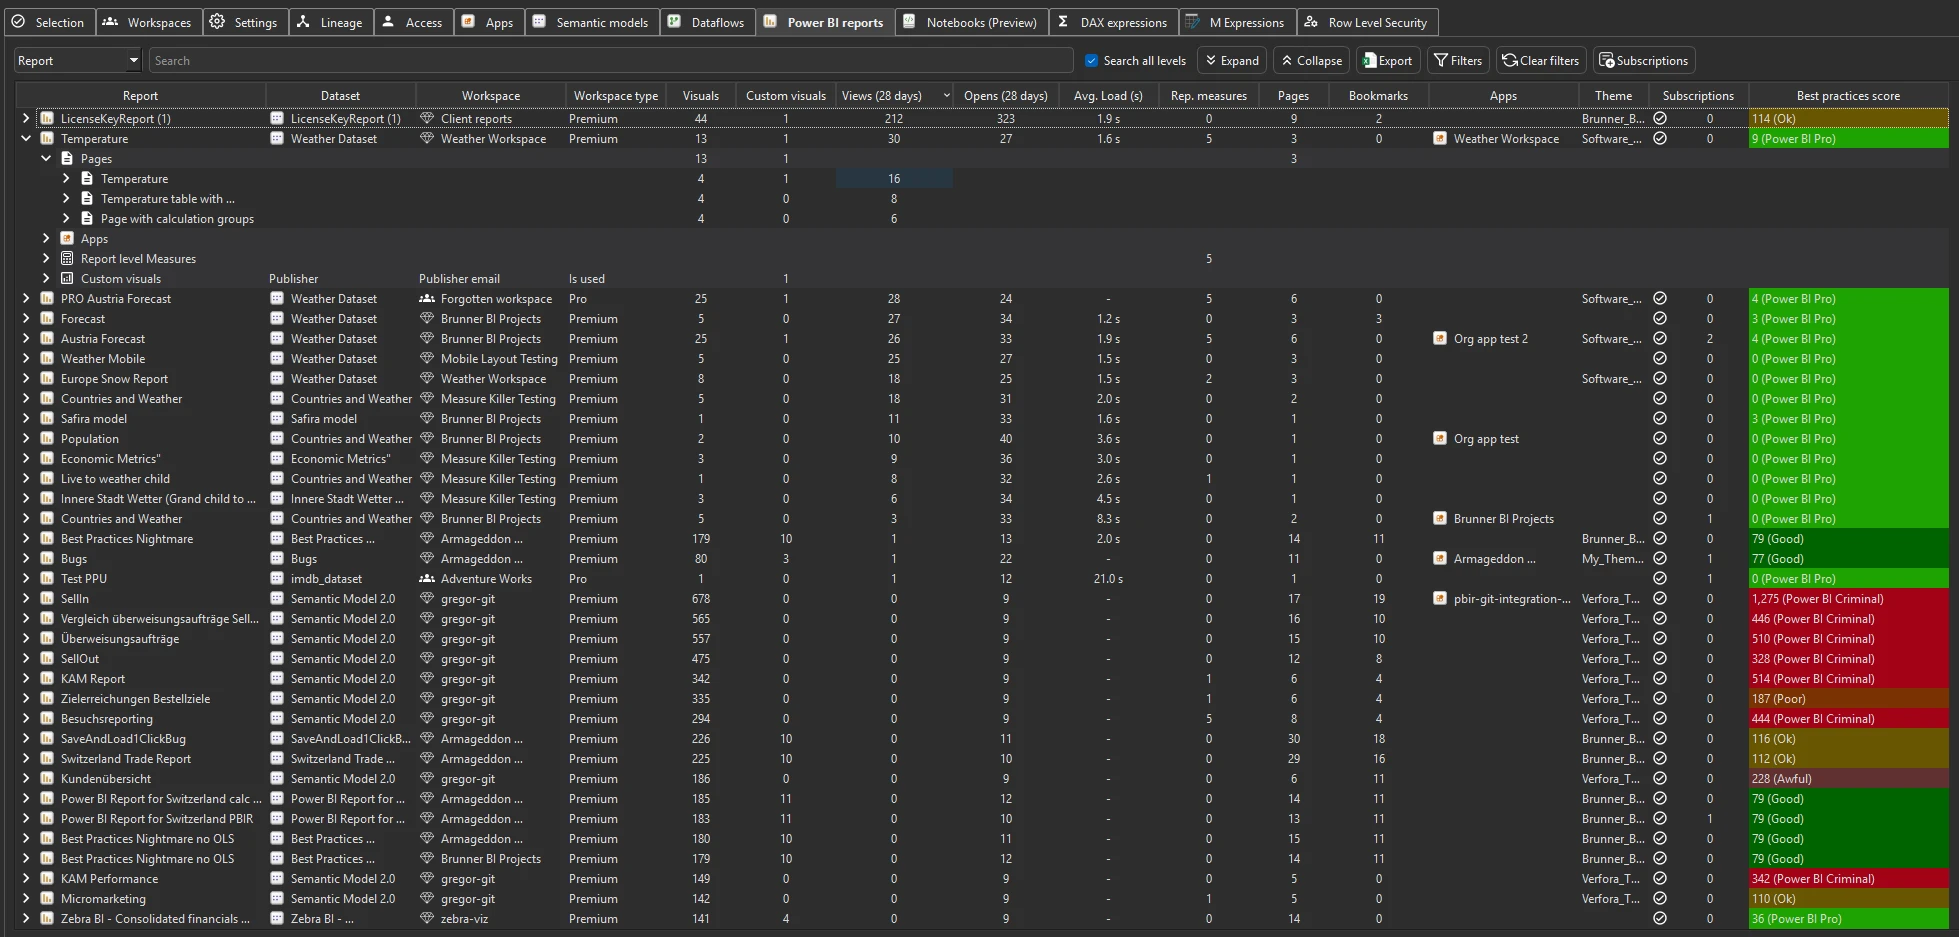
Enable Get report page views and load times before a Tenant Analysis scan. The Power BI reports tab then shows opens, views and load times per report, Report views adds the page-level detail, and Measure Killer keeps the history beyond Microsoft's 28 days.
Last updated · November 6, 2026
Steps
- Open Tenant Analysis or Limited Tenant Analysis and make sure Get report page views and load times is ticked in the filters.
- On the Selection tab, tick the semantic models or reports and click Analyze. Ticking a model pulls in the opens, page views and load times of every report on it (details).
- Open the Power BI reports tab. Sort Opens or Views descending for your most used reports, ascending for the ones nobody uses.
- Click Report views in the toolbar for the page-level detail: which pages are viewed and which are never opened.
- Right-click a report for its opens, page views and load times by date, as a table or a chart.
- Scan regularly. Each scan merges into a local database, so the history reaches past the 28 days the API returns (details).
What you see
Go deeper
- Report views & opens
- Find slow reports: load times from the same scan
- Clean your model: suggestions 8 and 9 use the same data
Something wrong or out of date on this page?