 Measure Killer
How do I see how many capacity units (CUs) each model, report, dataflow, notebook or other Fabric item uses?
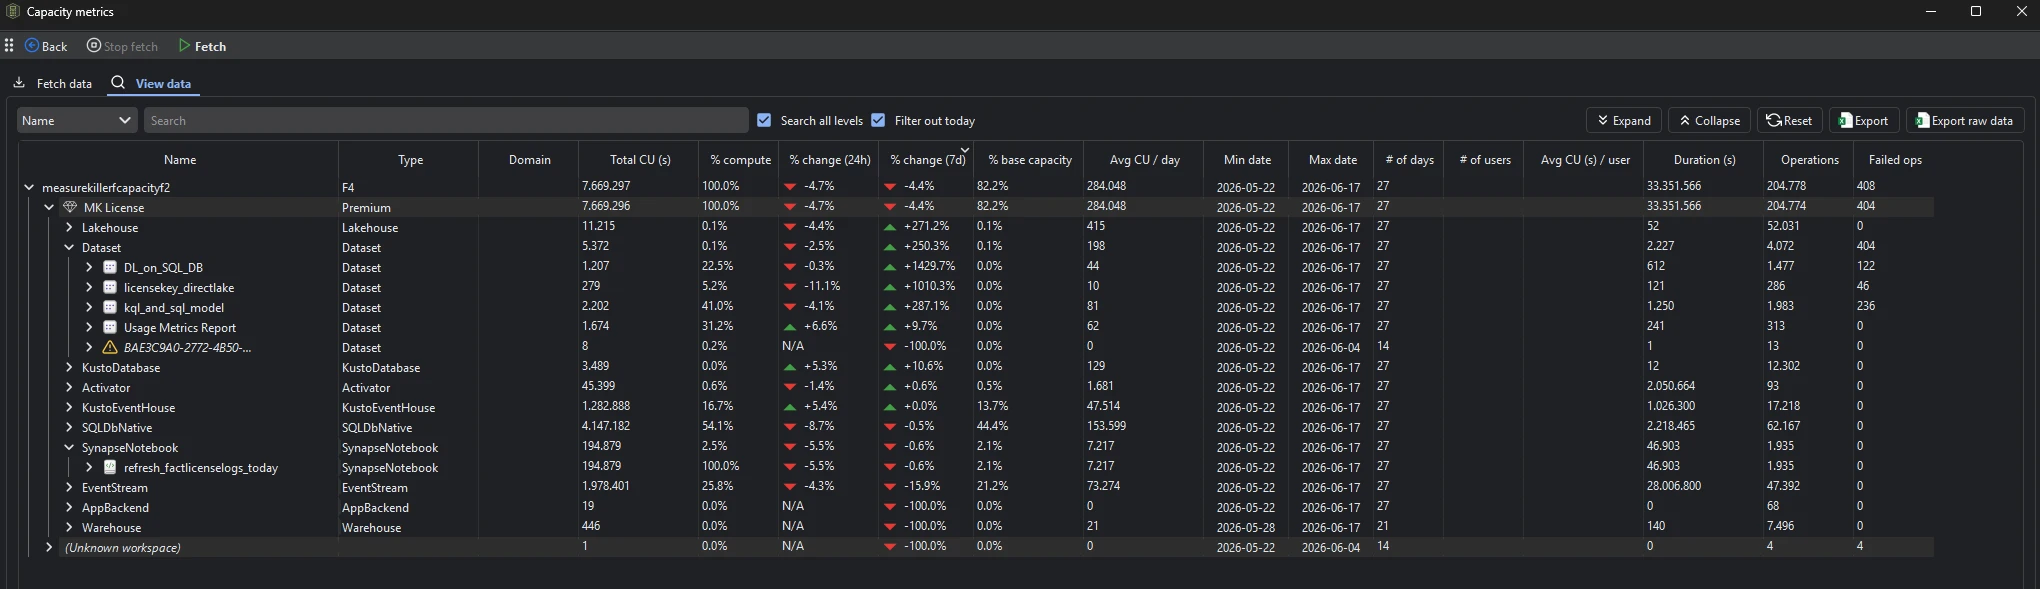
Tick Auto-fetch capacity metrics before a Tenant Analysis scan, or fetch it in the Capacity metrics window. The CU (s) column shows the consumption of every semantic model, report, dataflow and notebook, the Capacity metrics window breaks it down for every item type down to the operation, and Measure Killer keeps the history beyond Microsoft's 14 days.
Last updated · November 21, 2026
Steps
- Before the scan, tick Capacity Metrics → Auto-fetch capacity metrics in the filters, so the CU (s) columns fill during Phase 2.
- Run Tenant Analysis or Limited Tenant Analysis and click Analyze on the models you care about (details).
- Sort the CU (s) column on the Semantic models, Power BI reports, Dataflows or Notebooks tab.
- For every other item type as well, such as lakehouses, warehouses and pipelines, open Capacity metrics in the toolbar, click Fetch on the Fetch data tab, then switch to View data. It breaks the CUs down by capacity, workspace, item type, item and operation, with the trend over 24 hours and 7 days (details).
- Fetch regularly: each fetch merges into a local database, so your CU history grows beyond the 14 days Microsoft keeps.
What you see
Go deeper
Something wrong or out of date on this page?