Data lineage in Power BI — from source to visual
Trace how data flows through your Power BI and Fabric tenant at every level — server, database, table, view, and column-level from model to visual.
Last updated · June 9, 2026
What Measure Killer covers
Measure Killer gives you the most thorough data lineage available for Power BI and Fabric — end-to-end from data source to report, down to column-level model-to-visual detail, at 99.99% reference-detection accuracy, the highest in the industry.
“Lineage” means different things at different zoom levels. A governance lead asking “what breaks if we retire this database?” needs a coarse, item-level answer. A developer asking “which source column actually feeds this one broken visual?” needs the finest grain possible.
Measure Killer traces dependencies at three granularities today, with a fourth — full source-to-visual column lineage — in active development. Start broad at the Lineage tab, then narrow down as far as the question requires.
Server & database level — the Lineage tab
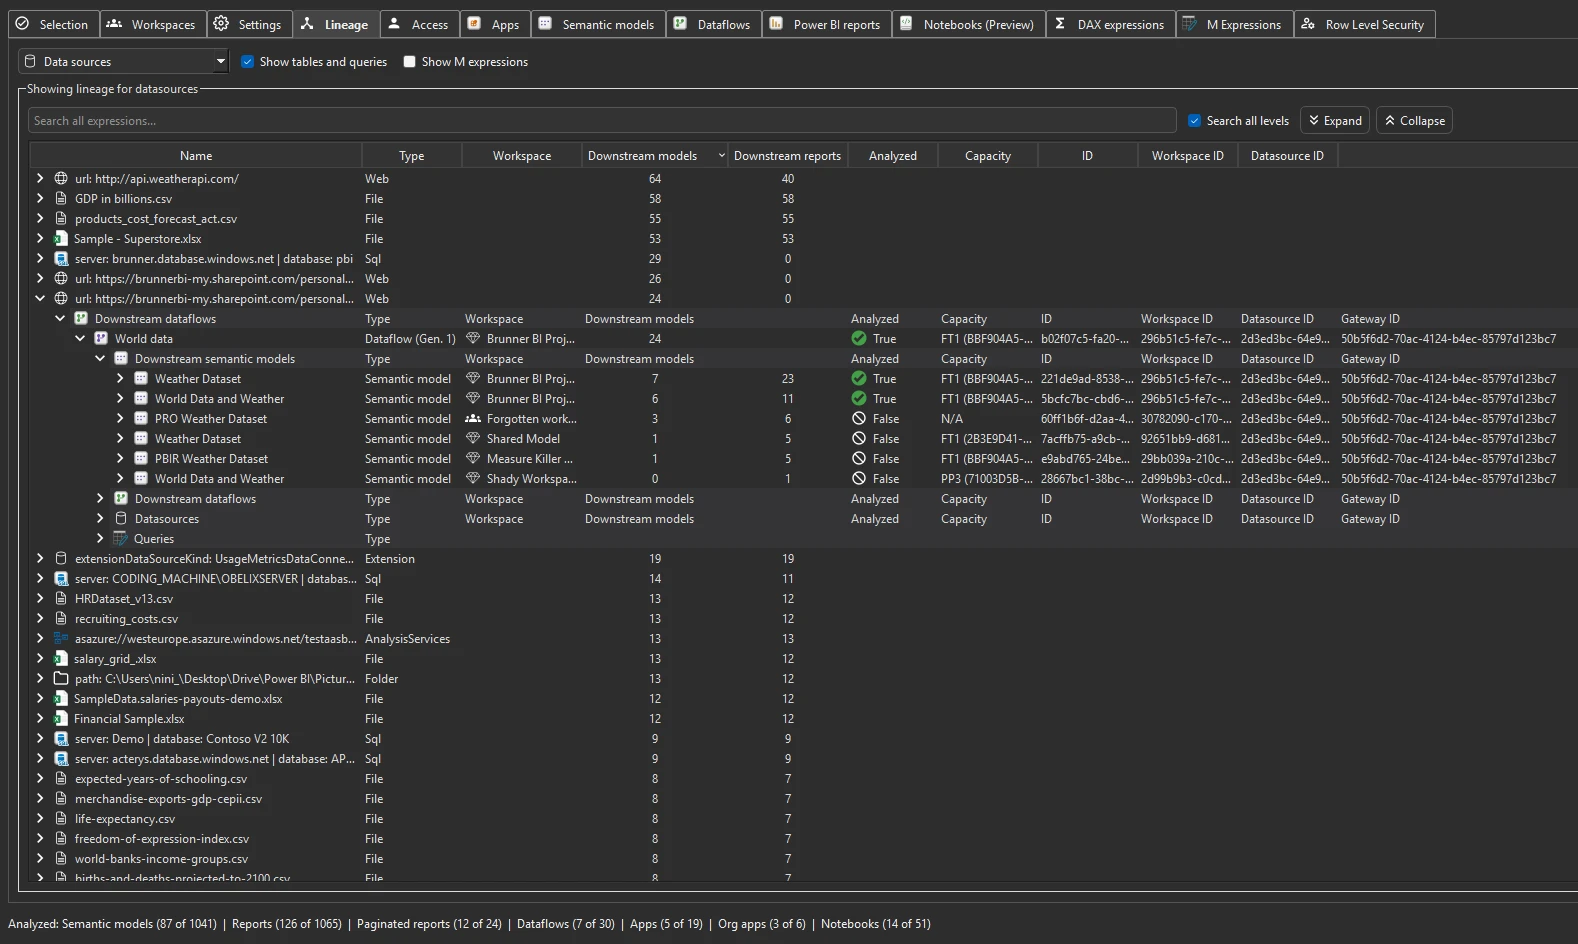
The Lineage tab is the top-down, item-level view, populated automatically by Phase 1 of a tenant-wide scan. It connects whole items — a data source, a dataflow, a model, a report — tracing each one from its data source through dataflows and semantic models to the reports, paginated reports, Excel files, and downstream models that consume it. A dropdown in the top-left corner switches between two views.
Data sources view. Starts from every data source in the tenant — server, database, file, or web — and shows what flows downstream. Each row lists the source type and the number of downstream semantic models and reports; expand it to trace the full path: source → semantic models → reports, paginated reports, Excel consumers, and downstream semantic models. This is the view that answers “what depends on this server or database?” — the starting point for impact analysis, a source migration, or a retirement.
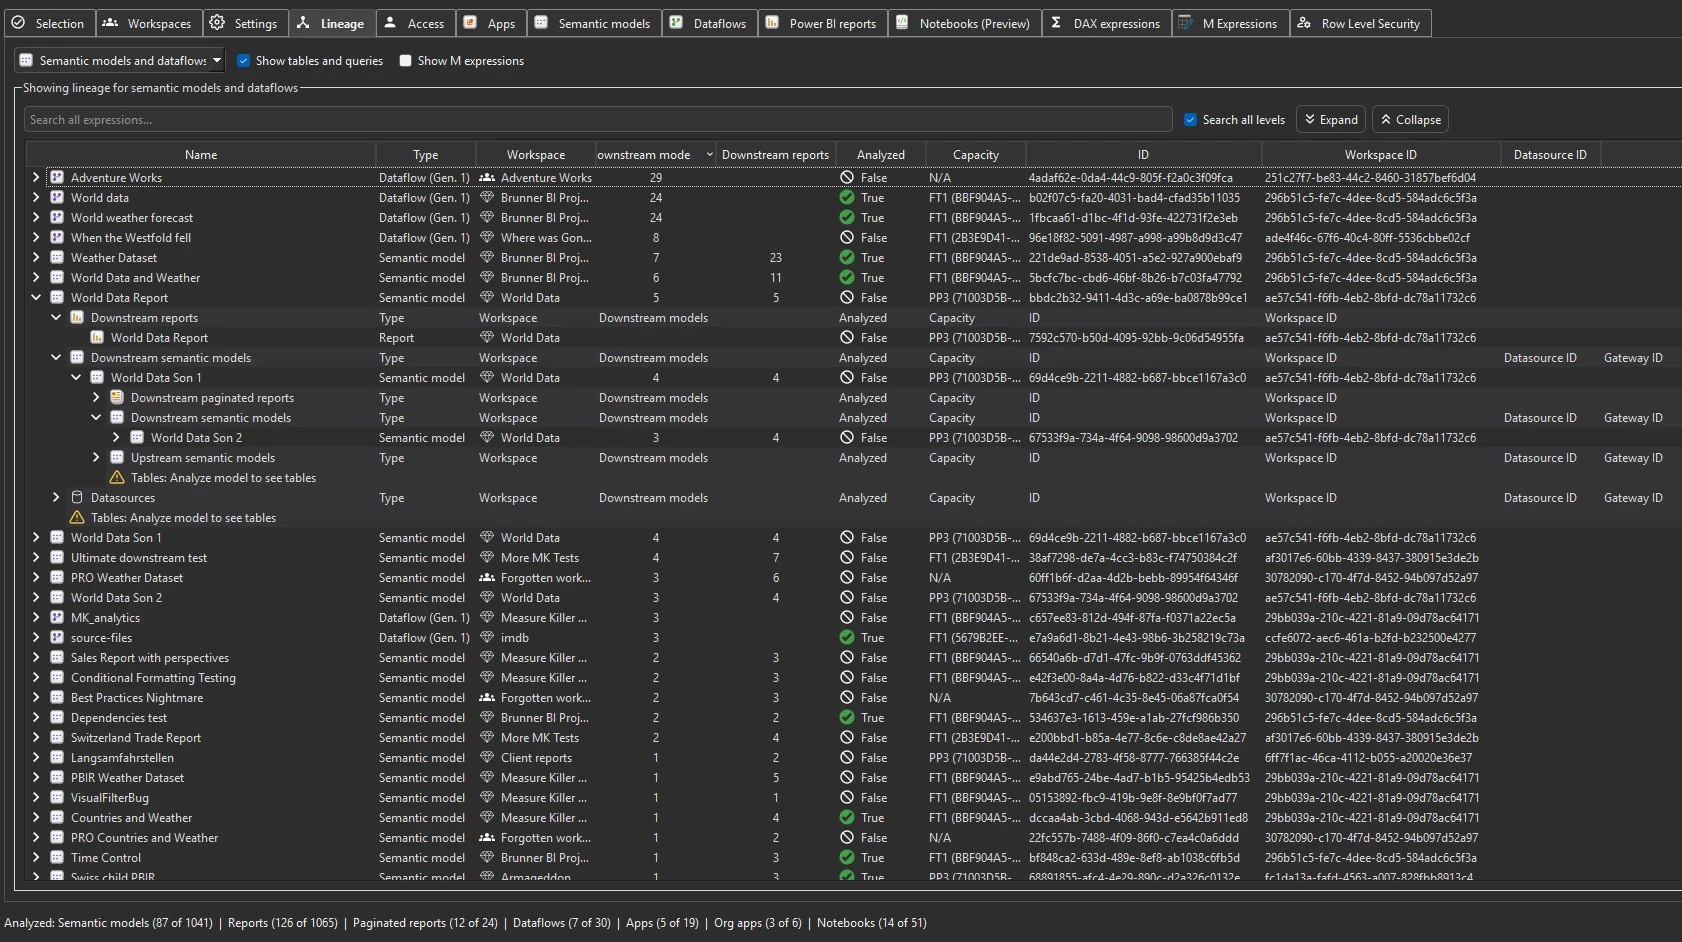
Models and dataflows view. Starts from every semantic model and dataflow and shows both directions at once: the upstream sources that feed each item and everything downstream that consumes it. Expand any model or dataflow to see its full dependency tree both ways — the view for “where does this model get its data, and what consumes it?”, and for surfacing the cross-workspace dependencies that quietly break workspace reorganizations and capacity migrations.
To run it, complete a tenant-wide scan
(lineage populates in Phase 1), open the Lineage tab, pick a view
from the top-left dropdown, then search or expand any row to follow its
upstream and downstream dependencies. Paid editions can export the
full lineage graph as JSON for a data catalog or governance
dashboard, or share the .measurekiller file so a colleague can
browse the same lineage without re-running the scan.
Table & view level — M Expressions search
The Lineage tab tells you which models touch a data source. To go one level finer — which models touch a specific table or view — search the M Expressions tab.
Every model and dataflow’s Power Query (M) code is indexed after a Phase 2 scan. Search for a table or view name and you get every item whose queries reference it. This is how table- and view-level lineage works today: it’s the precise list you need before renaming or dropping a database object.
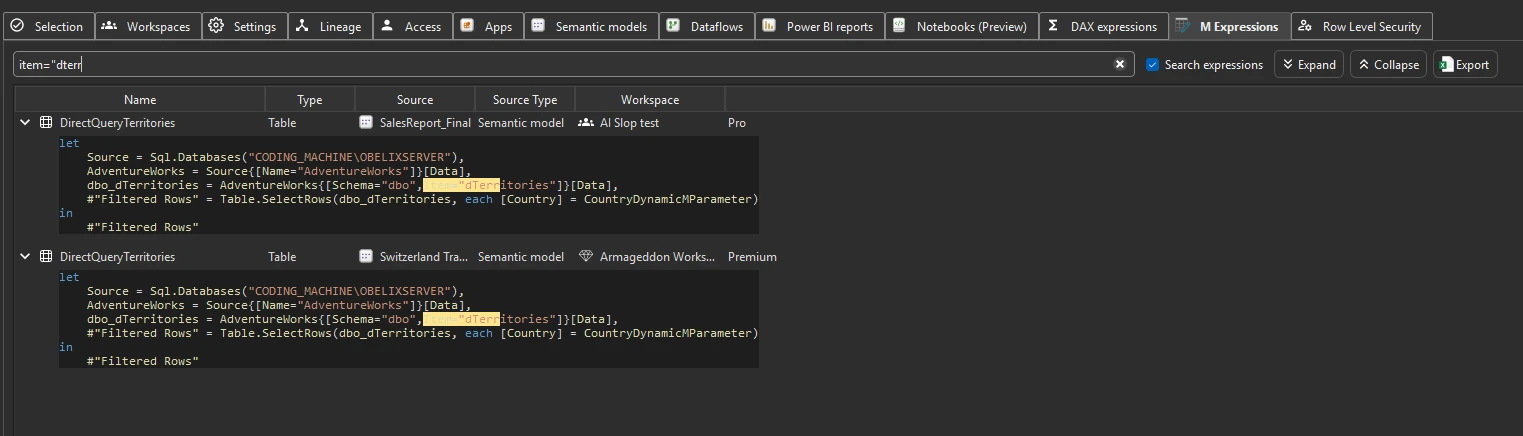
M Expressions search | Plan a database schema change
Column level — semantic model to visual (today)
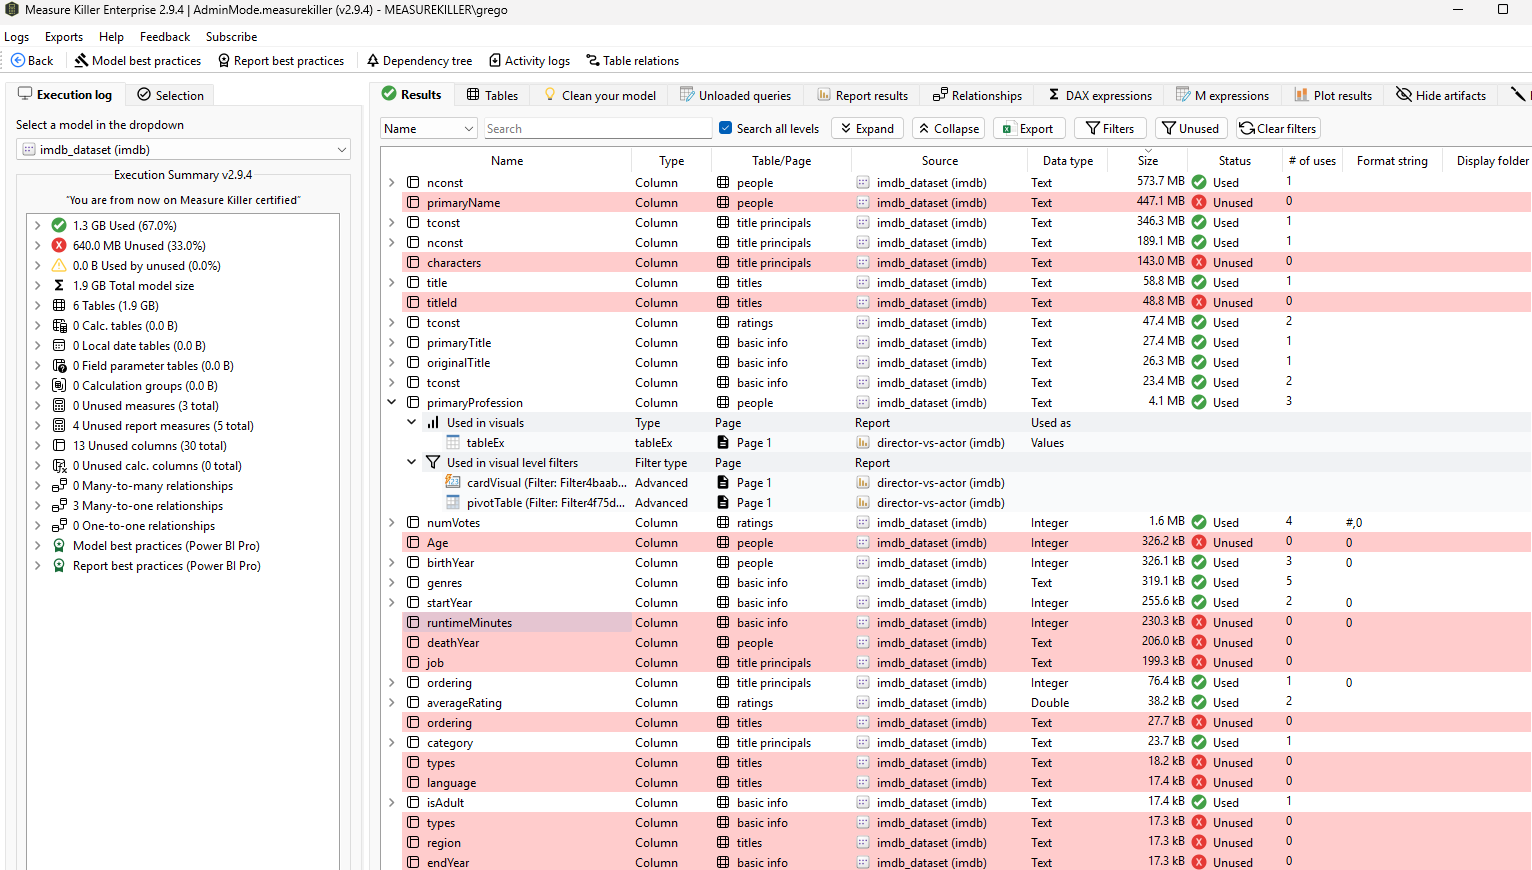
Inside a scanned model, Measure Killer traces column-level lineage from the semantic model all the way down to the individual visual. Pick any column or measure and see every visual, filter, calculation group, RLS rule, and downstream report that references it — across all connected reports.
This is the Where-used detail view. It works in the free desktop edition against a single open model, and tenant-wide after a Phase 2 scan with a paid license.
The same column-level analysis runs against Analysis Services models too — both SQL Server Analysis Services (SSAS, SQL Server 2019 or later) and Azure Analysis Services (AAS), Tabular models. A separate mode connects to the AS model and shows exactly which columns, measures and tables are used by downstream consumers — invaluable when migrating off Analysis Services, so you only carry over what’s actually needed.
Find and remove unused measures and columns (the Where-used view) | Find unused objects in Analysis Services models
Column level, end to end — coming September 2026
The piece in active development extends that same column-level precision upstream — through your dataflows back to the source database — so the trail runs unbroken from a warehouse column to the visual that renders it. Today the column-level half (semantic model → visual) already ships; the source-to-model half is what’s being built.
Source-to-visual column lineage (what’s coming)
Which granularity answers which question
| Your question | Where to look |
|---|---|
| What depends on this server, database, or data source? | Lineage tab |
| Which models or dataflows reference this table or view? | M Expressions search |
| Where is this column or measure used inside the model and its reports? | Where-used detail |
| Which source column feeds this exact visual, end to end? | Coming September 2026 |
Common workflows
- Impact analysis before a schema change. Work top-down: open the Lineage tab to see which models hit the source, narrow to the exact table with M Expressions search, then confirm the column-level blast radius inside each affected model with the Where-used view. See Plan a database schema change.
- Trace a number back to its source. Start at the report in the Lineage tab and follow it upstream through the semantic model to the data source — no more guesswork about where a figure comes from.
- Plan a migration. Use the dependency graph to sequence the move correctly: data sources first, then dataflows, then models, then reports. Lineage surfaces the cross-workspace dependencies that would otherwise break mid-migration.
- Decommission safely. Before retiring a data source or a database object, build the complete list of everything downstream so nothing is removed while a report still depends on it.
Related
- M Expressions search — table- and view-level tracing
- Find and remove unused measures and columns — column-level, model to visual
- Plan a database schema change — the workflow that combines all three levels
- Dependency tree — the per-model dependency concept
- Run a tenant-wide scan — the scan that builds tenant-wide lineage